
More Information
Submitted: August 12, 2022 | Approved: August 27, 2022 | Published: August 30, 2022
How to cite this article: Eva K, Felix G, Guenter G, Uwe L. Use of collagenase to isolate adipose tissue-derived stem cells – substantial manipulation or not? J Stem Cell Ther Transplant. 2022; 6: 008-018.
DOI: 10.29328/journal.jsctt.1001026
Copyright License: © 2022 Eva K, et al. This is an open access article distributed under the Creative Commons Attribution License, which permits unrestricted use, distribution, and reproduction in any medium, provided the original work is properly cited.
Keywords: Collagenase; Stem cells; Adipose tissue; Tissue dissociation; ATMP; Substantial manipulation

Use of collagenase to isolate adipose tissue-derived stem cells – substantial manipulation or not?
Koellensperger Eva*, Gramley Felix, Germann Guenter and Leimer Uwe
Clinic for Plastic, Aesthetic and Reconstructive Surgery, Spine, Orthopedic and Hand Surgery, Preventive Medicine, Ethianum, Germany
*Address for Correspondence: Koellensperger Eva, MD, PhD, Clinic for Plastic, Aesthetic and Reconstructive Surgery, Spine, Orthopedic and Hand Surgery, Preventive Medicine, Ethianum Vossstraße 6, 69115 Heidelberg, Germany, Email: [email protected]
Background: Collagenase is commonly used to isolate the stromal vascular fraction (SVF) or adipose tissue-derived stem cells (ADSCs) from human adipose tissue. Enzymatic breakdowns may be a substantial manipulation according to the classifications of medical regulatory authorities. This study investigates the possible effects of human adipose tissue dissociation with collagenase on in vitro function and behavior of ADSCs.
Methods and results: Adipose tissue from nine donors was divided into two equal fractions. SVF was then isolated either mechanically or with collagenase, respectively. The resulting cells were analyzed for their surface markers directly after isolation and at passage five. Proliferation, tri-lineage differentiation, and secretome markers were measured after passage four.
Using collagenase compared to mechanical isolation did not alter the expression of typical surface markers of ADSCs. ADSCs isolated with collagenase showed a significantly shorter population doubling time (p < 0.001), a significantly higher mean specific GPDH -activity, a stronger intensity in perilipin staining (p = 0.005), and a significantly higher extracellular calcium deposition (p = 0.006) than mechanically isolated ADSCs. The expression of adipogenic and osteogenic marker genes was not different in mechanically versus enzymatically isolated ADSCs. There were no significant differences in proteoglcyan production (p > 0.05) and the concentration of type 2 collagen. Except for an increased CCL2 concentration in mechanically isolated ASDCs (p = 0.01), there were no significant differences in the concentration of secreted proteins between both isolation methods.
Conclusions: The use of collagenase does not substantially impair central in vitro characteristics and functions of human adipose tissue-derived stem cells.
In recent years the number of fat transplants enriched with separated adipose tissue-derived stem cells has increased (also known as cell-assisted lipotransfer). Anticipated positive effects of the higher mesenchymal stem cell concentration include an augmented long-term volume, higher graft takes, and increased vascularization. Additionally, freshly isolated SVF from adipose tissue or more purified or pre-cultured adipose tissue-derived stem cells may be of relevance in different clinical situations such as regenerative medicine purposes. There are numerous different ways to isolate ADSC from adipose tissue. Two commonly used methods are mechanical isolation and the use of tissue dissociating enzymes. The perivascular location of ADSCs and their close contact with extracellular matrix structures, which need to be broken down during the isolation process [1-3], are considered to be the reasons why enzymatic methods yield higher numbers of progenitors/ADSCs. Thus, collagenases are often preferred to detach ADSCs from their original niche. However, enzymatic degradation may be a substantial manipulation according to the European Medicines Agency (EMA). This has led to classifying the method as ATMP (Advanced Therapy Medicinal Products) burdening the user with substantial additional work and costs [4,5]. Furthermore, some publications have raised safety issues for cellular suspensions won by enzymatic digestion, e.g. collagenase [2,6,7]. Seaman, et al. suggested that prolonging the duration of collagenase digestion of human adipose tissue to 50 minutes or more may significantly decrease the number of intact adipocytes and viable stromal cells compared to untreated tissue [8]. Liu, et al. have proposed that ADSCs have a short-term memory of environmental stimuli potentially leading to a change in their secretome and several microRNAs following stimulation with different pro-inflammatory factors [9]. So when collagenase-isolated ADSCs or the SVF are used clinically the question arises whether this represents a substantial manipulation of the cells and their function. This is important with regard to clinical safety, correct legal classification and compliance, and necessary precautions and requirements for approval. Therefore, it is important to analyze the potential effects of collagenase-induced tissue dissociation on the function and behavior of the ADSCs. This will improve the understanding of unplanned outcomes, potential risks, and side effects, and help answer important regulatory questions. For this reason, we split adipose tissue from nine donors into two equal portions and then either isolated the SVF mechanically or used collagenase. The resulting cells were analyzed for their surface markers directly after isolation and at passage five. Proliferation, tri-lineage differentiation, and secretome markers were measured after passage four. The main question was whether using collagenase to isolate the SVF compared to the mechanical method would alter the inherent properties of ADSCs.
All chemicals, if not noted separately, were purchased from Sigma-Aldrich, Munich, Germany.
Donor specification
After informed consent freshly excised subcutaneous adipose tissue of nine women with an age range of 40 years (median age 40.0 ± 12.3 years) undergoing elective liposuction procedures was used for isolation of SVF. Liposuction was performed according to standard operating procedures. Adipose tissue from liposuction was divided into two equal parts and immediately processed by two different methods. One part was processed in the GID system with GMP-grade collagenase according to the manufacturer’s instructions. The other part was processed mechanically without the use of collagenase. Cells of three donors were used for flow cytometry analysis directly after isolation (passage 0). The cells of the six other donors were cultured separately up to passage four under identical conditions and then analyzed separately with regard to surface markers, proliferation activity, differentiation ability, and cellular secretome.
Cellular isolation with collagenase
The enzymatic isolation was performed with the GID-SVF-1 system according to the manufacturer’s instructions by using GMP-grade collagenase (Serva, Kat. Nr. 17458, a lot-# 23430305). Briefly, 350 cc lactate ringer and 5,000 IU heparin/L were added to the liposuction material in the cartridge. Adipose tissue and fluid components were mixed by using the handle on top of the cartridge for 30 seconds. The fluid components were removed from the outer compartments of the cartridge and the washing steps were repeated twice. Collagenase proportional to the weight of the adipose tissue was added to the ringer lactate and filtered sterile. Next, the collagenase was added to the cartridges followed by incubation at 38 °C and 150 rpm for 40 minutes on a thermal horizontal shaker. Then, human albumin with a final concentration of 2.5% was added and the cartridge was centrifuged at 800 × g for 10 minutes at room temperature. The supernatant was removed and the pellet was resuspended in ringer lactate. The cell suspension was transferred from the cartridge to a sterile tube and centrifuged at 300 × g for 5 minutes at room temperature. The cells were washed twice with ringer lactate and centrifuged at 300 × g for 5 minutes at room temperature. The resulting pellet was resuspended in 12 ml erythrocyte lysis buffer (155 mM ammonium chloride, 10 mM sodium bicarbonate, 0.1 mM EDTA) and incubated for 3 minutes at room temperature. 20 ml of 2.5% human albumin in ringer lactate were added and the resulting suspension was centrifuged at 300 × g for 5 minutes at room temperature. The resulting pellet was washed twice in ringer lactate and centrifuged again at 300 × g for 5 minutes at room temperature. Then, the cells were resuspended in an expansion medium and seeded at a density of 1 × 10⁶ cells/cm2.
Mechanical cell isolation method
The liposuction material was transferred to sterile tubes. The adipose tissue was washed by adding a lactated ringer containing 2.5% human albumin. After mixing the tubes were centrifuged at 106 × g for 5 minutes at room temperature. The free fat and lactate ringer were removed and the washing steps were repeated two more times. Next, the washed adipose tissue was passed through a 100 µm nylon mesh by using a cell lifter spatula. A lactate ringer was added to the passed tissue followed by centrifugation at 106 × g for 5 minutes at room temperature. The supernatant was removed and erythrocyte lysis was performed by incubation with 155 mM ammoniochloride, 10 mM sodium bicarbonate, and 0.1 mM EDTA for 3 minutes. After two washing steps with 2.5%, human albumin in ringer lactate followed by centrifugation at 106 × g for 5 minutes at room temperature the cellular pellet was resuspended in an expansion medium and plated for cell culture experiments.
Cell culture and expansion
The cells were cultivated in an expansion medium consisting of 60% DMEM low glucose (1 g/L D-glucose) (Invitrogen, Life Technologies, Darmstadt, Germany), 40% MCDB-201, 1 x ITS (insulin, transferrin, selenous acid) (Becton Dickinson), 10-8 M dexamethasone, 0.1 mM ascorbic acid-2-phosphate, 2% human serum (Biochrom), 100 U/mL penicillin (Biochrom), 0.1 mg/ml streptomycin (Biochrom), 10 ng/mL rhEGF and 10 ng/ml rhPDGF-BB (CellSystems, Troisdorf, Germany)]. The medium was changed every other day. Once the cells reached 70% confluence they were detached with 0.25% trypsin-EDTA (Biochrom) and replaced with 3.5 × 10³ cells per cm2. ADSC was incubated at 37 °C with 5% CO2 and cultured up to passage four for further analysis.
Proliferative activity
Proliferative activity was analyzed in passage five by calculating cellular doubling time during the exponential growth phase. The cells of each donor were counted in six biological replicates. ADSCs of each condition were harvested with trypsin/EDTA once every 24 h from day 1 to day 5. The cells were stained with trypan blue and the viable cells were counted with a Neubauer chamber in technical duplicates. The generation time was calculated during the exponential growth phase by the formula: G [h] = (log2 × T)/(logY - logX), with T = time in culture [h], Y = number of cells at the end of T and X = number of cells at the beginning of T. The results were evaluated with the use of the Student’s t-test.
Flow cytometry
Analysis of cell surface markers was performed directly after isolation of the stromal vascular fraction (SVF, three donors, A, B, C) and after expansion of the cells of another six different donors (donors 1-VI) to passage four. The SVF pellet was resuspended directly after isolation in FACS-buffer (1% FCS, 0.1% NaN3 in PBS), washed, centrifuged, and suspended with a concentration of 540 cells/µl FACS buffer. This was followed by incubation with directly conjugated monoclonal antibodies (5 µl/100,000 cells) in FACS-buffer for 30 minutes on ice, washed twice with FACS buffer, and fixed with 1% paraformaldehyde/PBS. Cells were analyzed using a FACSCanto flow cytometry system (Becton Dickinson). Cells of the six other donors were expanded separately to passage four, pooled, and examined for surface marker expression using flow cytometry. The following monoclonal antibodies conjugated to fluorochromes were used: anti-CD73-PE, anti-CD90-APC, and anti-CD105-FITC (all from Becton Dickinson, Heidelberg, Germany). Isotype antibodies were included for all fluorochromes. Cells were analyzed using a FACSCanto flow cytometry system (Becton Dickinson). Data acquisition was performed with Diva software (Becton Dickinson) and data were analyzed using FCS Express V3 (De Novo Software).
Trilineage differentiation
Both, the mechanically and the enzymatically isolated cells of each donor were separately cultured to passage 4 and subsequently induced for adipogenic, osteogenic, and chondrogenic differentiation. Biological triplicates of each culture and differentiation method were separately measured in technical duplicates.
Adipogenic differentiation
Adipogenic differentiation was induced as described previously [10] with slight modifications. In brief, ADSCs were seeded in an expansion medium at a density of 24,000 cells/cm2. After reaching 90% confluence adipogenesis was induced by the alternated use of basal medium (10% FCS/DMEM) supplemented with IDI-mix (500 µM 3-isobutyl-1-methylxanthine; 1 µM Dexamethasone; 1 µM indomethacin) for 2 days followed by basal medium plus 10 µg/mL insulin for 1 day. The induction cycle was repeated three times. Adipogenic differentiation capacity was quantified by Measurement of glycerol-3-phosphate-dehydrogenase activity, perilipin staining, and the quantification of the expression of adipogenic marker genes (PLIN (perilipin), PPARG (peroxisome proliferator-activated receptor gamma), LIPG (endothelial lipase)) at day 7 and 14 of adipogenic differentiation via real-time PCR (polymerase chain reaction).
Measurement of glycerol-3-phosphate-dehydrogenase (GPDH ) ADSCs of passage 4 were cultured and adipogenic differentiation was induced as described above. On day 14 of the induction cycle, the cell layer was washed twice with PBS and harvested on ice with the use of a rubber policeman into extraction buffer (50 mmol/L Tris, pH 7.5; 1 mmol/L EDTA, 1 mmol/L b-mercaptoethanol). The cell suspension was treated on ice with the use of the microtip of a Bandelin Sonopuls HD 3100 sonifier (4 seconds, 0.02 KJ; Bandelin, Berlin, Germany). After centrifugation at 4 °C for 5 min at 8,000g, the supernatants were transferred to a fresh tube and measured for protein content with the use of the BCA assay (Pierce, Perbio, Bonn, Germany). The Measurement of glycerol-3-phosphate-dehydrogenase (GPDH ) in cell lysates was determined according to the method of Wise and Green [11], with minor modifications. Briefly, GPDH activity in the cell extracts was measured in assay buffer (100 mmol/L triethanolamine/HCl, pH 7.5; 2.5 mmol/L EDTA; 0.12 mmol/L NADH; 0.2 mmol/L dihydroxyacetone phosphate; 0.1 mmol/L b-mercaptoethanol) in a final volume of 125 µL. DeltaOD340 was determined with the use of a Tecan Sunrise (Tecan, Crailsheim, Germany) at room temperature in a 96-well UV plate (Greiner, Frickenhausen, Germany) and analyzed with the use of Magellan V6.4 software (Tecan). From each of the six donors, the biological triplicates of each isolation method were measured in technical triplicates. The measurements for all samples were performed in parallel on the same plate. Data are given as mean ± standard deviation of a total of nine measurements per donor and isolation method composition.
Perilipin staining cytoplasmic triglyceride lipid droplets were stained at day 14 of adipogenic differentiation. Cells were fixed with 4% PFA/PBS for 7 minutes, washed with PBS, and blocked with PBS supplemented with 50 mg Saponin (Sigma-Aldrich), 10 µl Gelatin from cold water fish skin (Sigma-Aldrich), and 500 mg BSA (bovine serum albumin, Sigma-Aldrich) for 30 minutes. Subsequently, cells were incubated with a primary anti-perilipin antibody (Progen, GP29, 1:200 in PBS) for 60 minutes, washed with PBS, and incubated with an Alexa fluor 488-conjugated secondary antibody (Thermofisher, A11073) for 30 minutes. Finally, the coverslips were washed with PBS, mounted (Rotimount Aqua, Roth, 2848.1) and analyzed with a Leica DM 2500 microscope.
Osteogenic differentiation
Osteogenic differentiation was induced for four weeks as described below and analyzed by measuring the extracellular calcium deposition and the expression of osteogenic marker genes ALPL (Alkaline phosphatase), RUNX2 (Runt-related transcription factor 2) by TaqMan real time-PCR. Furthermore, extracellular calcium deposition was determined by Alizarin red staining.
Measurement of extracellular calcium deposition was quantified 28 days after induction of differentiation by the O-cresolphtalein-complex-method referring to the protein level of the sample. Cell layers of osteogenically differentiated ADSCs were washed twice with PBS without Mg2+/Ca2+. Extracellular deposited Ca2+ was extracted with the use of 0.6 mol/L HCl by incubating the cells at room temperature on a plate rocker for 2 h. Extracts were centrifuged for 5 minutes at 15,700 × g, and Ca2+-content in the supernatants was quantified by use of the O-cresolphthalein complex method (Fluitest Ca-CPC, Biocon, Vöhl-Marienhagen, Germany). Subsequently extracted cells were washed three times with PBS without Mg2+/Ca2+, scraped with a rubber policeman into 0.1 mol/L NaOH/ 1% sodium dodecyl sulfate, and sonified as described above. After centrifugation at 4 °C and 8,000 x g for 5 minutes, the protein content of the supernatants was determined with the use of the BCA kit (Pierce, Rockford, IL, USA). From each of the six donors, the biological triplicates of each isolation method were measured in technical triplicates. Data are given as mean ± standard deviation of a total of nine measurements per donor and isolation method.
Alizarin red staining. On day 28 after induction extra-cellular calcium deposition was demonstrated by Alizarin red staining as follows: Monolayers of mineralized MSC were washed twice with excess PBS and fixed with pre-chilled 70% Ethanol for 1 hour at -20 °C. After a short washing step with H2O, the cell layer was incubated with 40 mM Alizarin red (pH 4.2) for five minutes at room temperature. After aspiration of unincorporated dye, cells were washed twice with H2O and once with PBS before photographic documentation.
Chondrogenic differentiation
Chondrogenic differentiation was induced for 6 weeks as described below. Chondrogenic differentiation was analyzed by quantifying the number of proteoglycans and the concentration of type 2 collagen. Furthermore, the deposition of proteoglycans was shown by Safranin 0/fast green staining.
Induction of in vitro chondrogenic differentiation. Cells from each donor and isolation method were harvested with trypsin/EDTA at passage 4. Pellets containing 5 × 10⁵ ADSCs each were formed in 1.5 mL Eppendorf reaction tubes by centrifugation of 50 × g for 5 minutes at room temperature. Chondrogenic induction medium consisted of DMEM high glucose (4.5 g/L D-glucose) (Life Technologies) supplemented with 0.1 µmol/L dexamethasone, 0.17 mmol/ L ascorbic acid 2-phosphate, 1.25 mg/mL BSA, 0.35 mmol/L Proline (all from Sigma-Aldrich), 100 units/mL penicillin, 100 µg/mL streptomycin (Biochrom KG), 1% insulin/transferrin/selenium supplement (BD Biosciences), 10 ng/mL TGF-β1 (Miltenyi Biotec), and 10 ng/mL bone morphogenic protein-6 (R&D Systems, Minneapolis, MN, USA). Pellets were cultured for 6 weeks in an induction medium with the medium being changed three times per week.
Immunocytochemical evaluation of chondrogenesis (safranin O/fast green staining). After 6 weeks of chondrogenic induction, pellets were fixed in 4% paraformaldehyde, dehydrated with isopropanol (70%, 96%, and 100%) and embedded in paraffin; 5mm sections were stained with safranin O/fast green for proteoglycans. In brief, sections were rehydrated in ethanol, washed with distilled water, and stained with 0.2% safranin O for 20 min. After another washing, sections were counterstained with 0.04% fast green for 30 seconds, washed, dehydrated in ethanol, and covered with Eukitt (Sigma-Aldrich).
Quantification of proteoglycans. Proteoglycans, collagen type 2, and DNA content were quantified from the same samples by use of fractionated extraction with guanidine hydrochloride (GuHCl, Sigma-Aldrich). Three pellets per donor and isolation method were homogenized with a pestle, and each homogenate was incubated with 500 µL GuHCl buffer (50 mmol/L Tris, 4 mol/L GuHCl, pH 8.5) for 30 min. After centrifugation of 15,700 x g for 15 minutes at room temperature, the resulting pellet was used for collagen type 2 quantification (see below). Furthermore, 200 µL and 3 × 100 µL of the supernatant was collected for quantification of DNA and proteoglycans, respectively. These supernatants were incubated with the use of 50 µL SAT buffer (0.75% triton in 0.3% H2SO4) for 15 min. Thereafter, 750 mL of 3% Alcian blue solution (Sigma-Aldrich) was added to stain the proteoglycans. After 30 min and centrifugation of 15,700 x g for 15 minutes at room temperature, the supernatant was discarded and the pellets were washed and incubated with 500 µL of DMSO buffer (40% in 0.05 mol/L MgCl2) for 30 minutes. After another centrifugation, the resulting pellet was resolved in guanidine/propanol buffer (4 mol/L guanidine-HCl, 33% 2-propanol, 0.25% Triton X-100). Chondroitin sulfate A (C9819, Sigma-Aldrich) was used as a standard. The absorption of the samples and the standard were measured at 650 nm. Data were normalized to the DNA content obtained with the use of the Qubit dsDNA Assay Kit (Life Technologies) according to the manufacturer’s instructions.
Quantification of collagen type 2. Collagen type 2 was measured by digestion of the above-mentioned pellets with pepsin solution (2.5 mg pepsin/mL, Sigma-Aldrich). After 24 h, the solution was neutralized with the use of 1 mol/L of tris base; 4.5 mol/L of NaCl was added, and the solution was slowly rotated overnight at 4 °C. After centrifugation of 15,700 × g for 30 min at 4 °C, the supernatant was discarded and the pellets were resuspended in 400 mL of precipitation buffer (0.1 mol/L tris base and 0.4 mol/L NaCl). The collagens were precipitated for 4 h at -20 °C by the addition of 100% ethanol. After another centrifugation step, the supernatant was discarded and the pellets were resuspended in lysis buffer (50 mmol/L tris, 150 mmol/L NaCl, and 1% Triton X-100). The collagen type 2 content was measured by use of native type 2 collagen detection enzyme-linked immunosorbent assay (ELISA) (Chondrex, Redmond, WA, USA) according to the manufacturer’s instructions. Results were normalized to the DNA content. From each of the six donors, biological triplicates of the two isolation methods were measured in technical duplicates. Data are given as mean ± standard deviation of a total of six measurements per donor and media composition.
Quantitative real-time polymerase chain reaction (qrt-PCR)
Adipogenic differentiation was determined by analyzing PLIN, PPRAG, and LIPG on days 7 and 14 of the differentiation process, and osteogenic differentiation was determined by analyzing ALPL and RUNX2 on days 7, 14 and 21. Total RNA was isolated using the Trizol Plus Kit (Life Technologies, Carlsbad, USA). Cells from six separate cultures wells per donor and isolation method were analyzed. The RNA-concentration was calculated by Quant-iT RNA-Assay (Life Technologies) and 1 µg was subjected to cDNA synthesis by the High Capacity cDNA
Reverse Transcription Kit (Life Technologies). Gene expression analysis was performed on a Step One Plus Instrument (Life Technologies) using TaqMan Real-Time PCR technology. Calculating the difference between the cycle threshold (CT) of the genes of interest and the CT of the endogenous controls from the same sample provided delta-CT values. The PCR analysis was performed three times with equal samples.
Human cytokine magnetic 30-Plex panel
Conditioned media from six separate culture wells per donor and isolation method were collected after 5 days of cell culture in passage 4, pooled, and measured in six technical replicates. Samples were measured undiluted as technical replicates in a human cytokine magnetic 30-Plex panel (LHC6003M, Life Technologies, Carlsbad, USA) with a Luminex 200 instrument (BioRad). The levels of 30 cytokines (CCL2, CCL3, CCL4, CCL5, CXCL-9, CXCL-10, EGF, Eotaxin, FGF-2, G-CSF, GM-CSF, HGF, IFN-α, IL-1β, IFN-γ, IL-1ra, IL-2, IL-2r, IL-4, IL-5, IL-6, IL-7, IL-8, IL-10, IL-12, IL-13, IL-15, IL-17, TNF-α, and VEGF) were simultaneously measured in all samples according to manufacturer’s instructions. The median fluorescent intensity was determined and the cytokine concentration was ascertained based on the standard curves for each cytokine. The mean value of the group-specific triplicates of all six donors and the respective standard deviation were calculated.
Statistical analysis
The results of cellular proliferation and differentiation assays were evaluated by SigmaStat Software (SYSTAT) using a student’s t-test. p - valuesp> < 0.05 were stated as significantly different. If the normality test failed a Wilcoxon Signed Rank Test was performed.
Mesenchymal stem cells from adipose tissue possess many favorable properties making them ideal candidates for regenerative medicine purposes. Isolation of these cells from adipose tissue can be performed by mechanical forces, enzymatic digestion, or a combination of both. Mechanical procedures like centrifugation, filtration, and micro-fragmentation have been used instead of enzymatic digestion in the isolation of SVFs [12].
The choice of isolation method, however, might influence the view of regulatory authorities on the classification of the resulting cellular product. It is a matter of discussion whether the use of collagenase to isolate SVF from adipose tissue should be considered a substantial manipulation leading to the classification of the resulting cells as an ATMP/somatic cell therapy medicinal product as defined in Part IV of Annex I to Directive 2001/83/EC, (EMA/561787/2017) [4]. In this context, substantial manipulation is usually defined as altering the cell’s biological characteristics, physiological functions, or structural properties relevant to the intended clinical use.
Whether substantial manipulation is present or not depends on the intended essential function of the cells as well as the medical or therapeutic claims. The Committee for Advanced Therapies (CAT) has classified SVF-cells as a tissue-engineered (medical) product, advanced therapy medicinal product (ATMP, somatic cell therapy medicinal product), or non-ATMP. If the preparation “does not contain cells that have been subject to substantial manipulation so that biological characteristics, physiological functions, or structural properties relevant for the intended clinical use have been altered and it does not contain engineered cells” it does not fall within the definition of an advanced therapy medicinal product. This is also true if “the cells are intended to be used for the same essential function(s) in the recipient and the donor” [13].
To further elucidate the possible effects of collagenase on the properties of ADSCs we collected liposuction material from nine healthy female donors. The lipoaspirate adipose tissue of each patient was divided into two equal parts. One part was processed mechanically, and one using collagenase. This allowed a direct individual comparison and the elimination of possible differences resulting from the harvest region, age, or individual circumstances. We evaluated the cells’ proliferative activity, surface marker expression, trilineage differentiation, and secretome.
Cellular proliferation
Proliferative activity was analyzed in passage 5. The cells of each donor were counted in six biological replicates. During the exponential growth phase ADSCcoll showed a significantly shorter population doubling time (19.8 ± 2.06 hours) than ADSCmechan (22.5 ± 3.53 hours) (p = 0.027 – p < 0.001). This might be due to the fact that mechanical isolation resulted in a lower initial cell number than enzymatically isolated cells. These cells consequently had to undergo more cell divisions to reach the necessary number of cells for differentiation analysis compared to cells isolated with collagenase. Our findings are consistent with the results of Chaput, et al. who found that enzymatic digestion of adipose tissue isolates more viable cells with an initially higher expansion rate and clonogenic enrichment than mechanically isolated cells [6]. Raposio, et al. compared an exclusively mechanical method (vibrating shaker and centrifugation) of ADSC-isolation with a combined method of mechanical (centrifugation) and enzymatical (collagenase) process and found the combined procedure to be five times more effective with regard to cell yield [3]. Alstrup, et al. proposed a combined enzymatical and mechanical procedure for the isolation of SVF. The combined procedure resulted in a three-fold higher MSC-yield in contrast to a sole enzymatic isolation process [14].
Flow cytometry
In the present study comparing collagenase to mechanical isolation, the expression of typical surface markers of ADSCs did not change directly after isolation nor at passage four. ADSCcoll and ADSCmechan were shown to be positive for CD13, CD44, CD63, CD73, CD90, CD105, and CD166 and negative for CD11b, CD31, CD34, CD45, CD106, and CD235a without qualitative differences in the expression of the aforementioned surface markers (Figure 1a,b). This is consistent with the results of Bellei, et al. and Li, et al. Neither group could show significant differences in ADSCs and surface marker profiles regardless of the isolation method (collagenase vs. mechanical) [2,15].
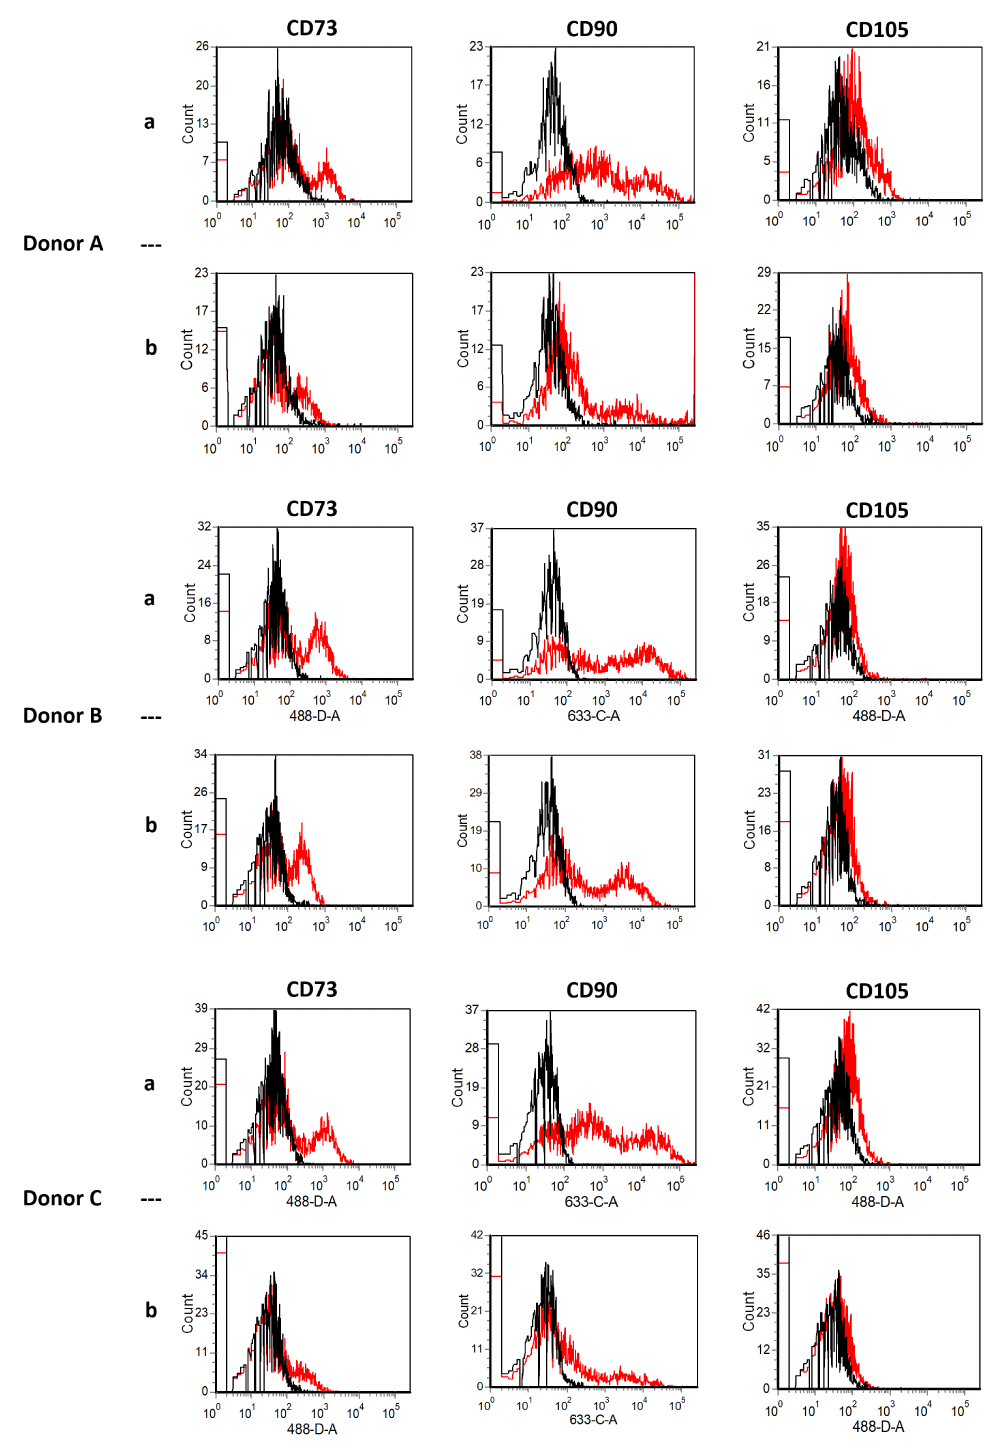
Figure 1a: Flow cytometry of stromal vascular fraction (SVF) from three donors (A-C) directly after isolation. Black lines show isotype controls, red lines show SVF signals [SVFcoll, row a; SVFmechan, row b]. SVF cells were positive for CD73, CD90, and CD105 without qualitative differences. Using collagenase compared to mechanical isolation did not alter the expression of typical surface markers.
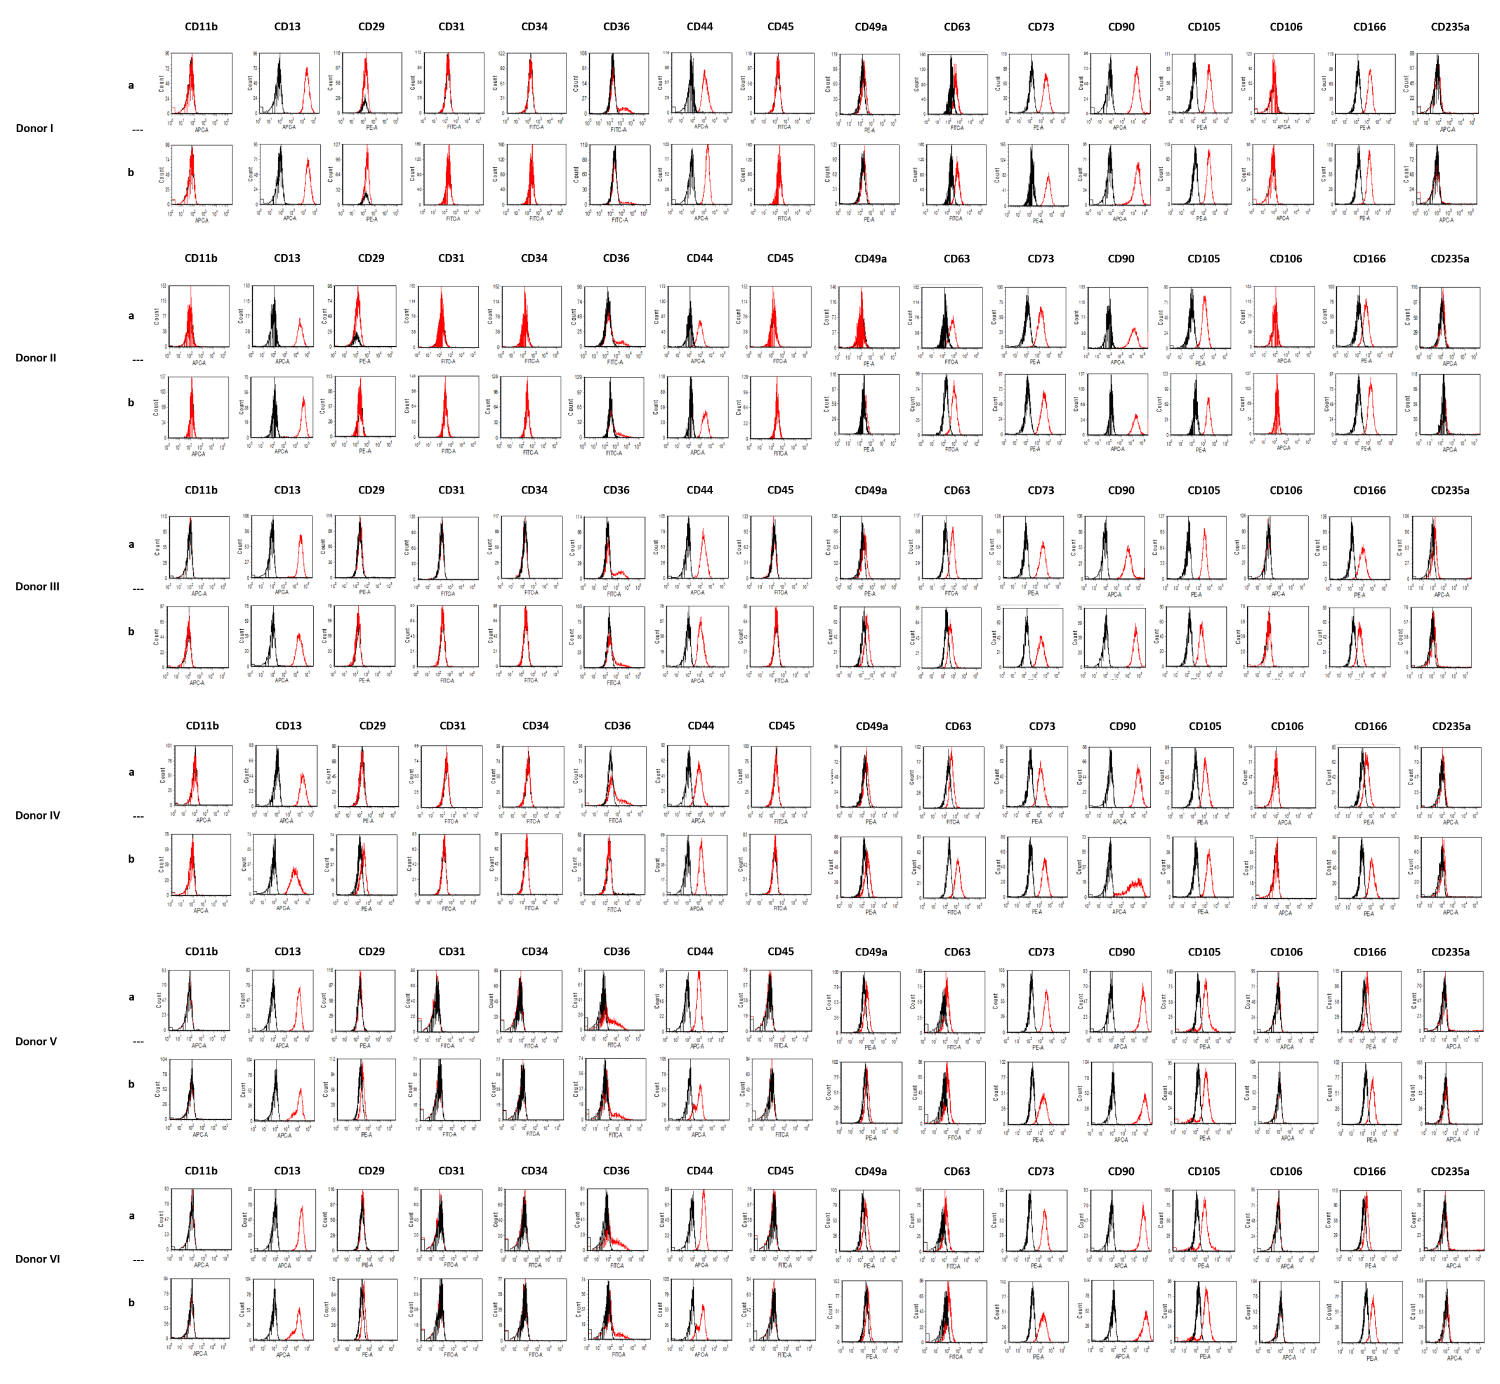
Figure 1b: Flow cytometry of ADSCs from six donors (I-VI) at passage 4. Black lines show isotype controls, red lines show ADSCs signals [ADSCcoll row a, ADSCmechan row b]. Using collagenase compared to mechanical isolation did not alter the expression of typical surface markers of ADSCs at passage four. ADSCcoll (row a) and ADSCmechan (row b) were shown to be positive for CD13, CD44, CD63, CD73, CD90, CD105, and CD166, and negative for CD11b, CD31, CD34, CD45, CD106 and D235a without qualitative differences in the expression of the aforementioned surface markers.
Trilineage differentiation
ADSCcoll showed a significantly higher mean specific GPDH -activity (801 ± 224 mU/mg protein) than ADSCmechan (212 ± 103 mU/mg protein) (p = 0.005). Furthermore, immunofluorescence showed a stronger intensity in perilipin staining for ADSCcoll than ADSCmechan (Figure 2) in five out of six donors. The expression of adipogenic marker genes (PLIN, PPARG, LIPG) on days 7 and 14, however, was not different in mechanically versus enzymatically isolated ADSCs (p > 0.05; data not shown).
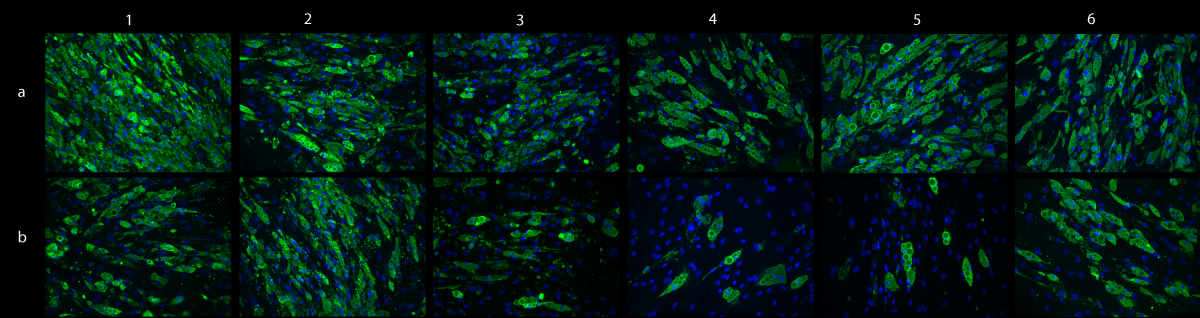
Figure 2: Adipogenic differentiation – perilipin staining. Immunofluorescent staining of perilipin shows intracellular lipid droplets as a sign of adipogenic differentiation in differentiated ADSCs from six different donors (donors I-VI, columns 1-6). Green: perilipin on intracellular lipid droplets, blue: nuclear DAPI stain. Cells isolated with collagenase (ADSCcoll; row a) show stronger lipid accumulation than mechanically isolated cells (ADSCmechan; row b) in five out of six donors (donors I, III, IV, V, VI; columns 1,3,4,5,6)
Marquez, et al. have shown that stimulation of cellular proliferation can be beneficial for adipogenesis during the mitotic phase by increasing the population of cells capable of committing to adipocytes [16]. Thus, the higher proliferative activity of ADSCcoll compared to ADSCmechan might explain the increased adipogenic differentiation ability of ADSCcoll.
Also, the fact that ADSCmechan compared to ADSCcoll had to undergo more cell divisions to reach the necessary number of cells for passaging before induction of differentiation, might have had an impact on overall differentiation ability.
ADSCcoll showed a significantly higher extracellular calcium deposition (3.14 ± 0.18 µg/ml Ca/µg/mL Protein) compared to ADSCmechan (2.10 ± 0.57 µg/mL Ca/µg/mL protein) (p = 0.006). However, Alizarin red staining after 4 weeks of osteogenic differentiation showed a stronger intensity in cultures from ADSCcoll than in those from ADSCmechan only in two out of six donors (Figure 3). The expression of osteogenic marker genes (ALPL, RUNX2) was not different in mechanically versus enzymatically isolated ADSCs (p > 0.05, data not shown).

Figure 3: Osteogenic differentiation - Alizarin Red S staining. Macroscopic pictures of osteogenically differentiated ADSCs of 6 donors (first row: donor I-III; second row: donor IV-VI) stained with Alizarin Red S at day 14 of osteogenic induction. Extracellular calcium stained with Alizarin Red S appears in red as a sign of osteogenic differentiation. Cells isolated with collagenase (ADSCcoll; rows a) only show a stronger calcium deposition than mechanically isolated cells (ADSCmechan; rows b) in two out of six donors (donors II and IV).
Furthermore, there were no significant differences between ADSCcoll (101 ± 105 µg/ml) and ADSCmechan (109 ± 102 µg/mL) regarding proteoglycan production (p > 0.05).
Staining of proteoglycans with Safranin O also did not show strong differences between the chondrogenically differentiated cells from both isolation methods (Figure 4). Additionally, the concentration of type 2 collagen did not show significant differences between cultures of ADSCcoll versus those of ADSCmechan (p > 0.05) after 6 weeks of chondrogenic differentiation.
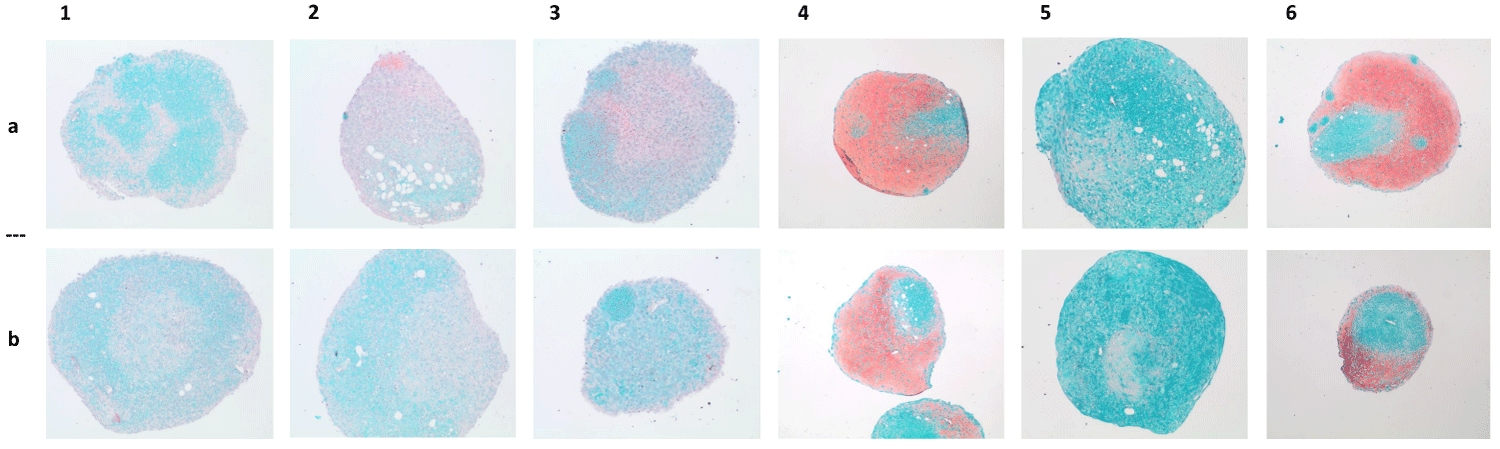
Figure 4: Chondrogenic differentiation - Safranin O staining. Macroscopic pictures of chondrogenically differentiated ADSCs of 6 donors (donors I-VI, columns 1-6; ADSCcoll, row a/ADSCmechan, row b) stained with Safranin O/Fast Green. Representative pictures of histological sections of induced pellets after six weeks of chondrogenic induction. Proteoglycans as a sign of chondrogenic differentiation stained with Safranin O appear in red. There is no visible difference in chondrogenic differentiation intensity between pellets from cells isolated with collagenase (ADSCcoll, row a) compared to pellets from mechanically isolated ADSCs (ADSCmechan, row b).
Our results are supported by the studies of Chaput, et al. and Busser, et al. who looked at the expression of various relevant genes with real-time PCR (Chaput, et al.) or quantifying Oil Red O, calcium/ALP activity, and Alcian blue stain in different isolation methods. In this setting, neither group found relevant differentiation properties changes in adipose-derived stromal cells [6,17].
Secretome
Conditioned media of cells of each donor were analyzed separately according to the two different isolation methods by multiplex Luminex assay technology (Life Technologies) on day 5 of culture in passage 4. Overall there was no significant difference in the concentration of the 30 measured proteins - except CCL2. ADSCmechan only showed a significantly higher CCL2-concentration in its conditioned media compared to cultures of ADSCcoll (ADSCmechan 4,637 (± 1,229) vs. ADSCcoll 2,764 (± 543), p = 0.01) (Table 1).
| Table 1: Analysis of cells secretome at passage 5. | |||
| Protein in pg/ml | ADSCmechan | ADSCcoll | Significance |
| bFGF | 4.92 (± 1.13) | 5.31 (± 0.71) | none |
| CCL2 | 4.64 (± 1.23) | 2.76 (± 0.54) | p = 0.01 |
| G-CSF | 22 (± 9.00) | 45.38 (± 21.96) | none |
| GM-CSF | 1.20 (± 0.21) | 1.30 (± 0.29) | none |
| HGF | 5,00 (± 2.74) | 5.72 (± 2.29) | none |
| IL-1b | 8.90 (± 4.64) | 9.14 (± 6.69) | none |
| IL-5 | 0.61 (± 0.26) | 0.53 (± 0.18) | none |
| IL-6 | 548 (± 334) | 440 (± 221) | none |
| IL-7 | 17.77 (± 0.00) | 16.18 (± 5.37) | none |
| IL-8 | 8.74 (± 2.31) | 8.03 (± 1.71) | none |
| IL-10 | 4.75 (± 1.08) | 4.55 (± 0.55) | none |
| IL-12 | 5.18 (± 0.92) | 6.49 (± 1.96) | none |
| IL-13 | 13.02 (± 2.06) | 13.35 (± 1.04) | none |
| IL-2R | 11.87 (± 12.00) | 7.70 (± 8.62) | none |
| IP-10 | 4.50 (± 0.31) | 4.43 (± 0.14) | none |
| MIP-1a | 21 (± 7.24) | 15.31 (± 4.29) | none |
| MIP-1b | 4.25 (± 2.49) | 4.67 (± 1.50) | none |
| TNFa | 0.35 (± 0.22) | 0.45 (± 0.16) | none |
| VEGF | 68 (± 26) | 65 (± 9.68) | none |
| Analysis of conditioned media from ADSCcoll and ADSCmechan was performed by multiplex Luminex assay technology (Life Technologies) showing the most relevant 17 out of 30 parameters. bFGF: basic fibroblast growth factor, CCL2: Chemokine (C-C motif) ligand 2, G-CSF: Granulocyte Colony-Stimulating Factor; GM-CSF: Granulocyte-Macrophage Colony-Stimulating Factor; HGF: Hepatocyte Growth Factor; IL-1b: Interleukin 1 beta; IL-5, 6, 7, 8, 10, 12, 13: Interleukin 5, 6, 7, 8, 10, 12, 13, IL-2R: Interleukin-2 Receptor; IP-10: Interferon gamma-induced protein 10, MIP-1a, MIP-1b: Macrophage Inflammatory Proteins; MCP-1: Monocyte Chemoattractant Protein-1; VEGF: Vascular Endothelial Growth Factor; Overall there were no significant differences in the concentrations of the measured proteins, except for CCL2. Conditioned media from ADSCmechan showed a significantly higher CCL2-concentration than that of ADSCcoll, p = 0.01. | |||
Qualitative differences were not detected. CCL2 is expressed in many tissues and under different circumstances. Among others, its expression in adipose tissue cells has been shown to be influenced by cell culture environmental changes, e.g. hypoxia or serum deprivation induce CCL2 expression [18,19].
This might explain the higher CCL2-protein levels in cultures from ADSCmechan compared to those from ADSCcoll since ADSCmechan compared to ADSCcoll had to undergo more cell divisions to reach the necessary number of cells for passaging. Furthermore, Lee, et al. showed that the expression of IL-6, IL-8 and CCL2 might change with the duration of collagenase digestion of adipose tissue and the enzyme concentration used [20]. In contrast to that, we did not see differences in the levels of IL-6 and IL-8 between cultures of ADSCcoll and ADSCmechan respectively, and CCL2 levels were higher in cultures from mechanically isolated cells.
Additionally, Li, et al. analyzed the concentration of six different growth factors by ELISA in the conditioned media of mechanically isolated ADSCs from passages 1 to 20 [15]. They could show that the secretome of these ADSCs was quite stable over time with an HGF concentration of more than 120 - 140 pg/mL, bFGF between 15 and 25 pg/mL, and VEGF being less than 10 pg/mL. These findings are roughly comparable to our measurements in passage 5. ADSCs isolated with collagenase, however, were not analyzed in their study.
Overall, according to our present data, the use of collagenase for isolation purposes does not seem to substantially impair ADSC’s medium-term in vitro properties. However, further studies, especially in vivo, need to be conducted to gain further insight into possible long-term changes.
To our knowledge, this is the first study analyzing the effect of a collagenase-based isolation protocol compared to a mechanical isolation procedure on the secretion of a broad spectrum of over 30 chemokines and cytokines by ADSCs in the context of a simultaneous rating of their proliferative activity, trilineage differentiation capacity, and surface marker expression. A major limitation of our study is the (potentially too late) point of analysis for most parameters. In passage 4 in a cell culture environment some differences between mechanically and enzymatically isolated cells might have decreased substantially or disappeared completely. However, isolating enough cells for immediate analysis of multiple parameters in two separate ways is often not possible. Furthermore, cells such as ADSCs regularly need some time after isolation to return to their normal function and shape. Therefore, the immediate analysis might not always display their properties accurately, either. Additionally, we wanted to show the mid-term effects of the ADSCs, since they might play an important role in their in vivo survival and function.
In the present study, the use of collagenase to isolate the SVF from adipose tissue did not substantially change the main characteristics of the included mesenchymal stem cell population. The pattern of cell surface markers, their differentiation capacities, and cellular proliferation activities only changed quantitatively but not qualitatively. The quantitative changes in cellular proliferation and differentiation activity might be due to the reduced cellular yield of the mechanical isolation method compared to the enzymatic isolation at the beginning of the culture period. A reduced cellular yield increases the number of cellular doublings necessary to reach confluence before further analysis. Our data might provide helpful information for the responsible authorities to decide whether cells isolated by collagenase are considered substantially manipulated or not.
Ethics approval and consent to participate
This study was conducted under the guidelines and with the approval of the ethical committees of the University of Heidelberg and of the medical association of the local district Baden-Wuerttemberg, Germany (Reference numbers S-462/2010 and S-022/2013).
All participants gave their informed consent prior to inclusion in the study. This study was performed according to the declaration of Helsinki.
This study was financially supported by Hopp Stiftung, Walldorf, Germany. The Hopp Stiftung did not influence the design of the study, the collection, analysis, and interpretation of data, or the writing of the manuscript.
- Aronowitz JA, Lockhart RA, Hakakian CS. Mechanical versus enzymatic isolation of stromal vascular fraction cells from adipose tissue. Springerplus. 2015 Nov 23;4:713. doi: 10.1186/s40064-015-1509-2. PMID: 26636001; PMCID: PMC4656256.
- Bellei B, Migliano E, Tedesco M, Caputo S, Picardo M. Maximizing non-enzymatic methods for harvesting adipose-derived stem from lipoaspirate: technical considerations and clinical implications for regenerative surgery. Sci Rep. 2017 Aug 30;7(1):10015. doi: 10.1038/s41598-017-10710-6. PMID: 28855688; PMCID: PMC5577104.
- Raposio E, Simonacci F, Perrotta RE. Adipose-derived stem cells: Comparison between two methods of isolation for clinical applications. Ann Med Surg (Lond). 2017 Jul 8;20:87-91. doi: 10.1016/j.amsu.2017.07.018. PMID: 28736612; PMCID: PMC5508488.
- Raposio E, Ciliberti R. Clinical use of adipose-derived stem cells: European legislative issues. Ann Med Surg (Lond). 2017 Nov 10;24:61-64. doi: 10.1016/j.amsu.2017.11.002. PMID: 29204274; PMCID: PMC5709339.
- Simonacci F, Bertozzi N, Raposio E. Off-label use of adipose-derived stem cells. Ann Med Surg (Lond). 2017 Oct 25;24:44-51. doi: 10.1016/j.amsu.2017.10.023. PMID: 29123656; PMCID: PMC5671395.
- Chaput B, Bertheuil N, Escubes M, Grolleau JL, Garrido I, Laloze J, Espagnolle N, Casteilla L, Sensebé L, Varin A. Mechanically Isolated Stromal Vascular Fraction Provides a Valid and Useful Collagenase-Free Alternative Technique: A Comparative Study. Plast Reconstr Surg. 2016 Oct;138(4):807-819. doi: 10.1097/PRS.0000000000002494. PMID: 27307342.
- Taghizadeh RR, Cetrulo KJ, Cetrulo CL. Collagenase Impacts the Quantity and Quality of Native Mesenchymal Stem/Stromal Cells Derived during Processing of Umbilical Cord Tissue. Cell Transplant. 2018 Jan;27(1):181-193. doi: 10.1177/0963689717744787. PMID: 29562771; PMCID: PMC6434486.
- Seaman SA, Tannan SC, Cao Y, Peirce SM, Lin KY. Differential Effects of Processing Time and Duration of Collagenase Digestion on Human and Murine Fat Grafts. Plast Reconstr Surg. 2015 Aug;136(2):189e-199e. doi: 10.1097/PRS.0000000000001446. PMID: 26218393; PMCID: PMC4676560.
- Liu GY, Liu Y, Lu Y, Qin YR, Di GH, Lei YH, Liu HX, Li YQ, Wu C, Hu XW, Duan HF. Short-term memory of danger signals or environmental stimuli in mesenchymal stem cells: implications for therapeutic potential. Cell Mol Immunol. 2016 May;13(3):369-78. doi: 10.1038/cmi.2015.11. Epub 2015 Mar 16. PMID: 25942600; PMCID: PMC4856802.
- Lin TM, Tsai JL, Lin SD, Lai CS, Chang CC. Accelerated growth and prolonged lifespan of adipose tissue-derived human mesenchymal stem cells in a medium using reduced calcium and antioxidants. Stem Cells Dev. 2005 Feb;14(1):92-102. doi: 10.1089/scd.2005.14.92. PMID: 15725748.
- Wise LS, Green H. Participation of one isozyme of cytosolic glycerophosphate dehydrogenase in the adipose conversion of 3T3 cells. J Biol Chem. 1979 Jan 25;254(2):273-5. PMID: 762059.
- Gentile P, Calabrese C, De Angelis B, Pizzicannella J, Kothari A, Garcovich S. Impact of the Different Preparation Methods to Obtain Human Adipose-Derived Stromal Vascular Fraction Cells (AD-SVFs) and Human Adipose-Derived Mesenchymal Stem Cells (AD-MSCs): Enzymatic Digestion Versus Mechanical Centrifugation. Int J Mol Sci. 2019 Nov 2;20(21):5471. doi: 10.3390/ijms20215471. PMID: 31684107; PMCID: PMC6862236.
- Advanced therapy classification: European Medicines Agency. https://www.ema.europa.eu/en/human-regulatory/marketing-authorisation/advanced-therapies/advanced-therapy-classification/summaries-scientific-recommendations-classification-advanced-therapy-medicinal-products).
- Alstrup T, Eijken M, Bohn AB, Møller B, Damsgaard TE. Isolation of Adipose Tissue-Derived Stem Cells: Enzymatic Digestion in Combination with Mechanical Distortion to Increase Adipose Tissue-Derived Stem Cell Yield from Human Aspirated Fat. Curr Protoc Stem Cell Biol. 2019 Feb;48(1):e68. doi: 10.1002/cpsc.68. Epub 2018 Oct 26. PMID: 30365239.
- Li J, Huang H, Xu X. Biological characteristics and karyotiping of a new isolation method for human adipose mesenchymal stem cells in vitro. Tissue Cell. 2017 Jun;49(3):376-382. doi: 10.1016/j.tice.2017.04.005. Epub 2017 Apr 24. PMID: 28499755.
- Marquez MP, Alencastro F, Madrigal A, Jimenez JL, Blanco G, Gureghian A, Keagy L, Lee C, Liu R, Tan L, Deignan K, Armstrong B, Zhao Y. The Role of Cellular Proliferation in Adipogenic Differentiation of Human Adipose Tissue-Derived Mesenchymal Stem Cells. Stem Cells Dev. 2017 Nov 1;26(21):1578-1595. doi: 10.1089/scd.2017.0071. Epub 2017 Oct 4. PMID: 28874101; PMCID: PMC5662072.
- Busser H, De Bruyn C, Urbain F, Najar M, Pieters K, Raicevic G, Meuleman N, Bron D, Lagneaux L. Isolation of adipose-derived stromal cells without enzymatic treatment: expansion, phenotypical, and functional characterization. Stem Cells Dev. 2014 Oct 1;23(19):2390-400. doi: 10.1089/scd.2014.0071. Epub 2014 Jul 3. PMID: 24805167; PMCID: PMC4172561.
- Strum JC, Johnson JH, Ward J, Xie H, Feild J, Hester A, Alford A, Waters KM. MicroRNA 132 regulates nutritional stress-induced chemokine production through repression of SirT1. Mol Endocrinol. 2009 Nov;23(11):1876-84. doi: 10.1210/me.2009-0117. Epub 2009 Oct 9. PMID: 19819989; PMCID: PMC5419165.
- Uchiyama T, Itaya-Hironaka A, Yamauchi A, Makino M, Sakuramoto-Tsuchida S, Shobatake R, Ota H, Takeda M, Ohbayashi C, Takasawa S. Intermittent Hypoxia Up-Regulates CCL2, RETN, and TNFα mRNAs in Adipocytes via Down-regulation of miR-452. Int J Mol Sci. 2019 Apr 22;20(8):1960. doi: 10.3390/ijms20081960. PMID: 31013606; PMCID: PMC6515141.
- Lee SJ, Lee CR, Kim KJ, Ryu YH, Kim E, Han YN, Moon SH, Rhie JW. Optimal Condition of Isolation from an Adipose Tissue-Derived Stromal Vascular Fraction for the Development of Automated Systems. Tissue Eng Regen Med. 2020 Apr;17(2):203-208. doi: 10.1007/s13770-019-00238-3. Epub 2020 Jan 29. PMID: 31997256; PMCID: PMC7105537.