
More Information
Submitted: November 18, 2022 | Approved: November 26, 2022 | Published: November 28, 2022
How to cite this article: Sherley JL, Daley MP, Dutton RA. Validation of Kinetic Stem Cell (KSC) counting algorithms for rapid quantification of human hematopoietic stem cells. J Stem Cell Ther Transplant. 2022; 6: 029-037.
DOI: 10.29328/journal.jsctt.1001028
Copyright License: © 2022 Sherley JL, et al. This is an open access article distributed under the Creative Commons Attribution License, which permits unrestricted use, distribution, and reproduction in any medium, provided the original work is properly cited.
Keywords: Hematopoietic stem cell; Apheresis; Mobilization; CD34; Cord blood; Stem cell transplantation; Algorithm
Abbreviations: TSC: Tissue Stem Cell; CPC: Committed Progenitor Cell; KSC: Kinetic Stem Cell; HSC: Hematopoietic Stem Cell; MSC: Mesenchymal Stem Cell; UCB: Umbilical Cord Blood; MPBC: Mobilized Peripheral Blood Cell; SCF: Stem Cell-Specific Fraction; SCFHL: Stem Cell Fraction Half-life; PDT: Population Doubling Time; CPD: Cumulative Population Doublings; PSCK: Probabilistic Stem Cell Kinetics; RIFS: Random Input Factor Search; SQS: Simulation Quality Score; fRMSE: Fractional Root-Mean-Squared Error; P: Passage; SRC: SCID Mouse Repopulating Cell; TEMP: Tissue-Engineered Medicinal Product

Validation of Kinetic Stem Cell (KSC) counting algorithms for rapid quantification of human hematopoietic stem cells
James L Sherley1*, Michael P Daley2 and Renly A Dutton1,3
1Asymmetrex®, LLC, Boston, Massachusetts, USA
2Institute for Applied Life Sciences, University of Massachusetts, Amherst, Massachusetts, USA
3Iodigit, LLC, Mission Viejo, California, USA
*Address for Correspondence: James L Sherley, M.D, Ph.D, Asymmetrex®, LLC, PO Box 301179, Boston, Massachusetts, 02130, USA, Email: [email protected]
Specific quantification of therapeutic tissue stem cells (TSCs) is a major challenge. We recently described a computational simulation method for accurate and specific counting of TSCs. The method quantifies TSCs based on their unique asymmetric cell kinetics, which is rate-limiting for TSCs’ production of transiently-amplifying lineage-committed cells and terminally arrested cells during serial cell culture. Because of this basis, the new method is called kinetic stem cell (KSC) counting. Here, we report further validations of the specificity and clinical utility of KSC counting. First, we demonstrate its quantification of the expected increase in the hematopoietic stem cell (HSC) fraction of CD34+-selected preparations of human-mobilized peripheral blood cells, an approved treatment product routinely used for HSC transplantation therapies. Previously, we also used the KSC counting technology to define new mathematical algorithms with the potential for rapid determination of TSC-specific fractions without the need for serial culture. A second important HSC transplantation treatment, CD34+-selected umbilical cord blood (UCB) cells, was used to investigate this prediction. We show that, with an input of only simple population doubling time (PDT) data, the KSC counting-derived “Rabbit algorithms” can be used to rapidly determine the specific HSC fraction of CD34+-selected UCB cell preparations with a high degree of statistical confidence. The algorithms define the stem cell fraction half-life (SCFHL), a new parameter that projects stem cell numbers during expansion culture. These findings further validate KSC counting’s potential to meet the long-standing unmet need for a method to determine stem cell-specific dosage in stem cell medicine.
A long-standing need in stem cell medicine has been a convenient means for routine determination of the specific dosage of tissue stem cells (TSCs) in cell transplantation treatments [1-3]. Like pharmaceutical and biopharmaceutical medicine, stem cell medicine would improve if the dosage of the essential therapeutic agent were known [3]. A convenient method for routine determination of TSC-specific dosage would improve progress in the manufacture of TSC medicinal products [4] progress in stem cell and stem-gene therapy clinical trials, and the quality of approved TSC treatments [3,5,6].
This unmet clinical need has persisted for more than half a century because, for most TSCs, molecular biomarkers that identify them exclusively have proven elusive [1-3]. One exception to this disappointment is skeletal muscle satellite stem cells that can be exclusively identified in vivo by their specific expression of the transcription factors Pax3 and Pax7 [7]. However, in vitro during cell culture for expansion, even these biomarkers lose their exclusivity for identifying only long-lived tissue-renewing stem cells [8-10]. More widely used biomarkers for hematopoietic stem cells (HSCs; i.e., CD34 and CD133) [1] and mesenchymal stem cells (MSCs; i.e., CD73 and CD90) [11] also identify committed progenitor cells (CPCs) as well, both in vivo and in vitro. There is a common misconception in stem cell medicine that these widely available biomarkers for characterizing HSC-containing and MSC-containing cell preparations can quantify these TSCs by flow cytometry. However, since these biomarkers also detect the more numerous CPCs produced by TSCs, which predominate in both freshly isolated and cultured tissue cell preparations, they do not quantify TSC fraction and dosage [2-4].
In the case of HSCs, which are the only TSCs approved for routine medical treatments, the limiting-dilution SCID mouse repopulating cell (SRC) assay can be used to estimate the HSC-specific fraction of hematopoietic cell preparations [3,12]. However, because the SRC assay has several challenging features that make it impractical for routine usage, it has never been developed and approved for clinical practice [3,12].
A new method for accurate and specific determination of the fraction and dosage of therapeutic human TSCs was recently described [13]. The method is called kinetic stem cell (KSC) counting to reflect its underlying biological principle. KSC counting is a computational simulation method that quantifies TSCs based on their unique cell kinetics. Normal primary mammalian tissue cells maintain their in vivo cell kinetics programs ex vivo in cell culture [14-16]. These programs are TSC-based cell turnover units, which, although losing many in vivo cell differentiation properties, maintain terminal division arrest by committed cell lineages [17-19]. When primary tissue cells are serially passaged in culture, the total cell output kinetics are determined by the number and proliferation kinetics of the TSCs in the culture. The KSC counting computational simulation software uses an underlying probabilistic TSC-based turnover unit cell kinetics model to decipher from serial culture cell count data the rate-limiting TSC fraction and kinetics [13].
Before this report, we described the validation of the KSC counting technology by four orthogonal tests. Three of the four validation tests (1,2 and 4 below) involved human HSCs in either bone marrow or umbilical cord blood preparations. The validations were 1) comparison to published data ranges for limiting-dilution SCID mouse repopulating cell assays for both CD34+-selected human bone marrow cells and umbilical cord blood cells; 2) CD34+ fractionation analyses; 3) comparison to independent cytological methods for detecting asymmetrically self-renewing cells, and 4) analysis of changes in detected stem cells after treatments with agents that increased stem cell expansion or were stem cell-toxic [13].
Previously, KSC counting was also used to define new mathematical algorithms for rapid computation of the TSC-specific fraction (SCF) of mammalian cell cultures. Now, we describe further development of these “Rabbit algorithms” for routine, rapid counting of therapeutic TSCs. The present report details further validations of KSC counting and the rapid counting Rabbit algorithms. Commercial therapeutic preparations for human HSCs are used to show that KSC counting quantifies the expected enrichment of HSCs after CD34+ cell fractionation, and we confirm that rapid-counting Rabbit algorithms for CD34+ umbilical cord blood (UCB) HSCs accurately compute the HSC fraction of both parallel and secondary independent CD34+ UCB cell preparations. These validations continue to advance KSC counting as the first method for routine determination of the specific fraction and dosage of therapeutic TSCs for stem cell science and medicine. These newest studies increase confidence that KSC counting can have a major impact on improving the quality of stem cell science and medicine and accelerating their progress to delivering better stem cell treatments for patients.
Cells
Three independent lots of human CD34+-selected UCB cells from different anonymous donors were purchased from HemaCare-Charles River Laboratories, Northridge, CA, USA (Cat# CBC34C-3) and pooled for the described analyses. The pooled cell samples were fortuitously from two male and one female donor; and from one “Hispanic,” one “Caucasian,” and one “Other” donor. The cell viabilities of the thawed samples determined by trypan blue dye exclusion were respectively 97%, 96% and 96%.
Peripheral blood preparations from anonymous G-CSF-mobilized donors were purchased from HemaCare-CRL (Cat# M009C-1) and Stemcell Technologies, Vancouver, BC, Canada (Cat# 70049.4). Respectively, the fortuitous traits for donor 1 were male, blood type A-, “Hispanic,” and 59 years old; and for donor 2 they were male, blood type O-, “Caucasian,” and 35 years old. The respective cell viabilities of the thawed samples were 95% and 92%.
CD34+-selected blood cells from anonymous G-CSF-mobilized donors were purchased from HemaCare-CRL (Cat# M34C-GCSF-1) and AllCells, Quincy, MA, USA (Cat# mLP RegF CR CD34 PS 1M). Respectively, the fortuitous traits for donor 1 were male, blood type O-, “Hispanic,” and 54 years old; and for donor 2, they were M, blood type A+, “Black/African American,” and 40 years old. The respective cell viabilities of the thawed samples were 91% and 97%.
Serial culture for KSC counting
Suspension serial culture was performed in 24-well cell culture plates with 2 ml culture medium at 37oC in humified incubators with a 5% CO2 atmosphere. All culture studies were conducted in StemSpan™ SFEM II culture medium (Stemcell Technologies, Cat# 09655) supplemented with StemSpan™ CD34+ Expansion Supplement (Stemcell Technologies, Cat# 02691) as specified by the supplier and 1% penicillin/streptomycin (Gibco, Cat# 15140122).
The pooled CD34+ UCB cells were used to initiate two duplicate sets of serial cultures in parallel as described later for mobilized peripheral blood cells (MPBCs). One duplicate serial culture set was passaged with 1:10 splits, and the other duplicate serial culture set was passaged with 1:5 splits. The remainder of the pooled cells were used to initiate three 12 mL cultures in 75 cm2 T-flasks. The input cell numbers for the flask cultures were 7.4 × 10⁵, 1.1 × 10⁶ and 9.6 × 10⁵. After 73 hours of culture, the respective recovered cell numbers were 6.4 × 10⁶, 5.0 × 10⁶ and 6.0 × 10⁶. The respective cell viabilities of recovered cells were 92%, 92% and 93%. The recovered cells from each T-flask culture were divided into 3 equal aliquots and cryopreserved in liquid nitrogen. The cryopreserved cells were designated as passage 1 (P1) cells, and subsequent cultures initiated with them were designated as P2 secondary serial cultures.
The initiating P1 CD34+ UCB cell serial cultures were initiated with 150,000 viable cells per 2.25 mL culture medium and performed in duplicate. Unfractionated MPBC cultures and CD34+-selected MPBC cultures were initiated with 100,000 viable cells per 2.25 mL culture medium and performed in duplicate. P2 CD34+ UCB secondary cultures were initiated with 100,000 viable cells per 2.25 mL culture medium and performed in triplicate. Except for the 1:5 split basis for one duplicate set for the P1 CD34+ UCB cell serial cultures, all cultures were passaged every 3 days with a 1:10 split basis. At each passage, the passage interval time was recorded with quarter-hour precision; and triplicate samples of collected culture cells were counted for trypan dye-excluding (live) and staining cells (dead) with a hemocytometer slide. Serial cultures were continued until either no increase in cell number was observed or no cells were detectable for two consecutive passages (i.e., terminal cell proliferation arrest or terminal cell dilution limit, respectively).
KSC counting software analyses
The Probabilistic Stem Cell Kinetics (PSCK), Random Input Factor Search (RIFS) and PDT: SCF algorithm programming and software, which comprise the novel KSC counting technologies, have been described [13]. In this report, the PSCK-RIFS software is renamed TORTOISE Test® software; and the PDT: SCF algorithm discovery software is renamed the RABBIT Count® software. Public access for use of the KSC counting software is available as a free calculator at https://asymmetrex.com/stem-cell-counting-center/. Formulae and calculators for PDT and CPD can be found on the same website.
All reported KSC counting analyses are based on 10 independent computer simulations of experimental CPD data. Each optimal simulation results from 1000 searches by the TORTOISE Test® software for sets of initial TSC, CPCs and terminally arrested cell fractions and cell kinetics factor values that can compute the observed experimental data based on a TSC-based turnover unit model [13]. The mean simulation quality scores (SQS) for all reported analyses ranged from 0.004 to 0.23 (median = 0.05), well below the ideal threshold SQS ≤ 0.5 [13].
Initial cell kinetics factors determined by the TORTOISE Test® software (Table 1) were used to define Rabbit algorithms as described previously [13]. The algorithms were derived with 10 independent computations of the experimental CPD data that gave simulations with fractional root-mean-squared error values (fRMSE) that were ≤ 0.10. fRMSE is the RMSE of a CPD data simulation compared to the experimental CPD data divided by the maximum value of the experimental CPD data.
Statistical and graphical analyses of KSC counting software outputs were performed with 2020 GraphPad Prism 9 for macOS software, version 9.0.0.
SCID mouse repopulating cell assays
Two independent replicate cryopreserved samples of the CD34+ UCB cells, used for the KSC counting algorithm validation studies, were shipped on dry ice to the Indiana University In Vitro Therapeutics & Angio BioCore Facility (Indianapolis, IN, USA) and evaluated in limiting dilution SCID mouse repopulating cell (SRC) assays. Before these analyses, the on-site thawed cells were cultured for 72 hours.
Immunodeficient NSG mice were supplied by Jackson Laboratories (Bar Harbor, ME, USA) under Indiana University IACUC Assurance Identification #A9429-01. For each of the two independent vials of thawed and cultured CD34+ UCB cells, 100, 500, 2500, and 7500 viable cells were injected into respective groups of 8 female mice according to published methods [20,21]. After 16 weeks, animals were sacrificed, bone marrow and peripheral blood were collected, and the isolated cells were analyzed by flow cytometry with fluorescence-conjugated isotype control antibodies and antibodies specific for selected human hematopoietic antigens. Flow cytometry gating was based on analyses with mock-injected control mice (data not shown).
Data sharing statement
All primary total cell count, dead cell fraction, and CPD data are deposited for the free access in Science Data Bank at http://www.doi.org/10.11922/sciencedb.01355.
KSC counting analyses of CD34+ UCB cells
We evaluated commercial human HSC preparations that are widely used for HSC research and HSC transplantation medicine without the benefit of HSC-specific fraction or dosage. Figure 1 provides the key elements of a TORTOISE Test® software KSC counting analysis for CD34+ UCB cells. After about ten 3-day serial passages, these cultures reach a characteristic terminal proliferation arrest [15,22]. The total cell count data at each passage (Figure 1A, circles) is transformed into CPD data (Figure 1A, squares). The KSC counting TORTOISE Test® software searches for unknown initial cell kinetics factors that, together with measured cell culture factors, achieve a close simulation of the experimental CPD data (Figure 1B) [13]. Among the initial cell kinetics factors discovered is the HSC-specific fraction of the initial cultured sample (Table 1; CD34 UCB, SCF).
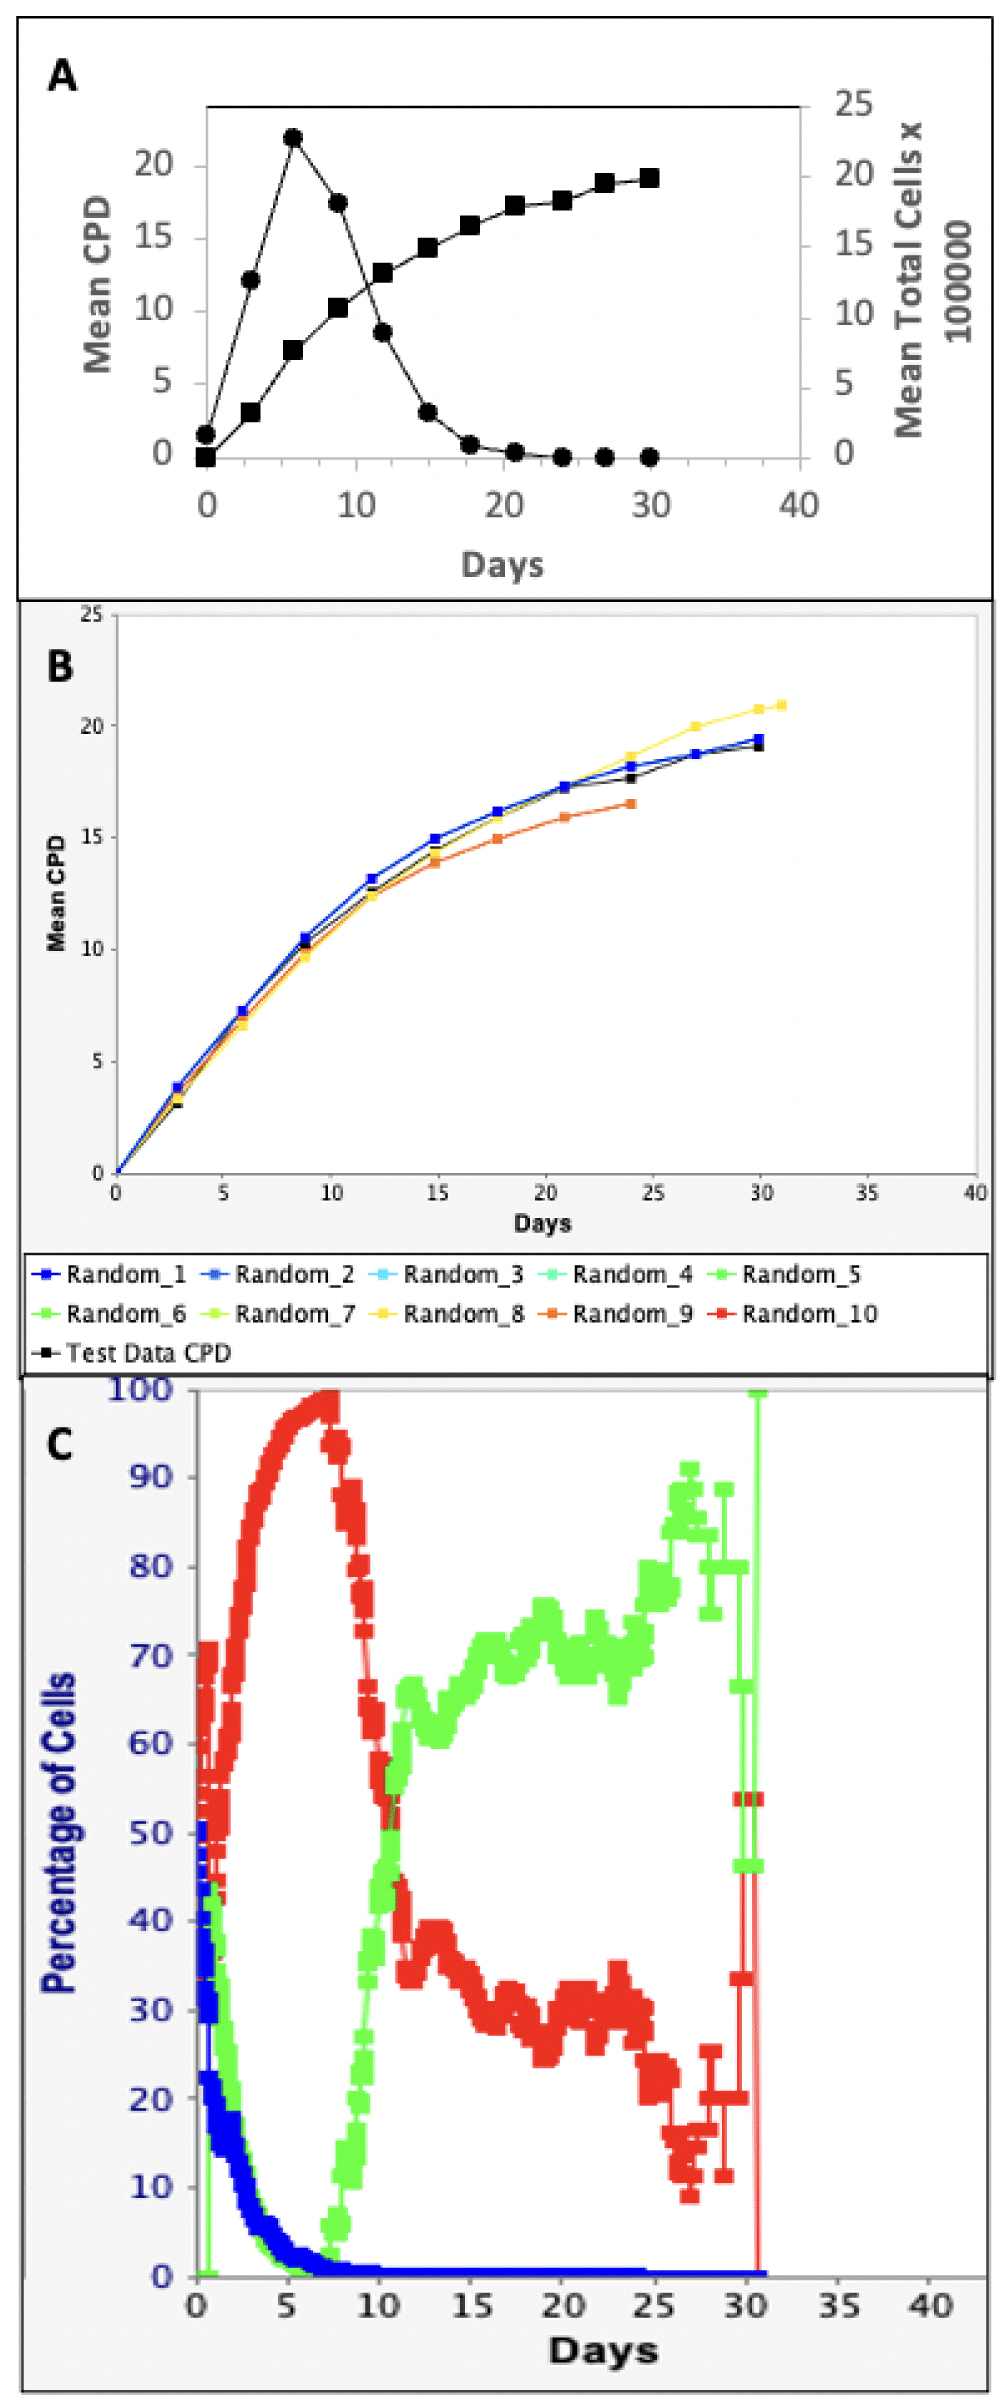
Figure 1: KSC counting TORTOISE Test® software analysis of human CD34+-selected UCB cells. The data from duplicate parallel serial cultures were evaluated. A. Input cell count data for the KSC counting software analysis. Circles, right y-axis, experimental mean total cell number at each passage of cell culture, based on the transfer of 1/10 of culture cells approximately every 3 days. Squares left y-axis, mean CPD data derived from the mathematical transformation of the mean total cell number data. B. The PSCK module of the TORTOISE Test® software was used to compute 10 independent simulations (Note: some simulations are coincident) of the mean CPD data (black squares; same as in A) using input initial cell kinetics factors that were randomly selected within the statistical ranges defined by the TORTOISE Test® KSC counting software (See Table 1). C. The randomly-selected initial cell kinetics factors for one of the simulations in B (fRMSE = 0.042) were used to compute respective cell kinetics profiles for HSCs (blue), CPCs (red), and terminally-arrested cells (green) during serial passaging.
As presented in Table 1, the KSC counting TORTOISE Test® software also discovers other important TSC-specific kinetics factors and cell kinetics factors specific to CPCs and terminally-arrested cells (data not shown). Using the PSCK module of the software (See Materials and methods), these initial cell kinetics factors can be used to calculate the relative cell kinetics profiles for HSCs, CPCs, and terminally-arresting cells during the serial passaging (Figure 1C).
“Rabbit algorithms” for rapid counting of human HSCs from different sources
Table 1 summarizes initial cell kinetics factors determined by TORTOISE Test® KSC counting analyses of three different types of cell preparations containing HSCs from three different suppliers. The preparations include the described CD34+ UCB cells, G-CSF-mobilized unfractionated peripheral blood cells, and G-CSF-mobilized CD34+-selected peripheral blood cells. Importantly, all CD34+-selected cell sources had a significantly higher HSC-specific fraction (Table 1, SCF). Although the HSC fraction of the two different donor sources of unfractionated MPBCs differed significantly, they were both significantly lower than the HSC fraction of all CD34+-selected preparations. In contrast, all three preparations for CD34+-selected cells had higher statistically equivalent HSC fractions. The mean increase in HSC fraction for the CD34+-selected MPBC preparations compared to unfractionated MPBCs was 9.5-fold (p < 0.01 by the unpaired, two-tailed Student’s t - test).
Numerical differences were noted among the five evaluated HSC sources for TORTOISE Test® initial cell kinetics factors. However, only a few differences were statistically significant and only for some comparisons. These included a lower rate of HSC symmetric self-renewal by one source of unfractionated MPBCs (Table 1, MPBC, HemaCare, SC SSR); a lower rate of CPC death by the same commercial source of unfractionated MPBCs and CD34+ UCB cells (Table 1, CPC Death Rate); and a generally greater number of CPC divisions before terminal division arrest by CD34+ UCB cells (Table 1, TDN).
| Table 1: Comparison of Initial Cell Kinetics Factors Determined by KSC Counting of Commercial Human Hematopoietic Cell Preparations1. | |||||
| CD34 UCB2 | MPBC | CD34 MPBC | |||
| Cell Supplier | HemaCare | HemaCare | Stemcell Tech | HemaCare | AllCells |
| (Mean; 95% Confidence Interval) | |||||
| Hematopoietic Stem Cell Factors | |||||
| SCF | 0.72; 0.58-0.85 | 0.02; 0.01-0.03 | 0.15; 0.06-0.24 | 0.78; 0.61-0.96 | 0.83; 0.76-0.91 |
| SC SSR | 0.40; 0.23-0.57 | 0.13; 0.06-0.20 | 0.39; 0.17-0.62 | 0.51; 0.30-0.71 | 0.35; 0.18-0.52 |
| SC Asym CC Time | 8.4h; 4.4-12 | 9.9h; 7.4-12 | 18h; 10-25 | 8.9h; 5.5-12 | 12h; 3.4-20 |
| SC Sym CC Time | 24h; 16-31 | 9.1h; 6.2-12 | 13h; 6.8-19 | 19h; 11-28 | 19h; 12-27 |
| SC Death Rate | 0.07; 0.01-0.13 | 0.21; 0.09-0.32 | 0.28; 0.09-0.47 | 0.15; 0.02-0.28 | 0.18; 0.05-0.30 |
| SCFHL | 1.37; 1.30-1.44 | 2.13; 0.21-id3 | 1.10; 0.79-1.67 | 3.16; 2.26-4.74 | 1.54; 1.43-1.66 |
| Committed Progenitor Cells Factors | |||||
| CPC CC Time | 24h; 22-26 | 12h; 10-15 | 14h; 10-18 | 20h; 12-28 | 17h; 12-23 |
| CPC Death Rate | 0.01; -0.01-0.04 | 0.07; 0.03-0.12 | 0.45; 0.26-0.64 | 0.33; 0.07-0.59 | 0.19; 0.01-0.38 |
| TDN | 10; 9.5-11 | 5; 3-7 | 5; 2-8 | 6; 2-11 | 7; 4-10 |
| 1Determination from N = 10 simulations. 2CD34 UCB, CD34+ - selected umbilical cord blood cells; MPBC: Mobilized Peripheral Blood Cells; SCF: TSC-Specific Fraction; SC SSR: Stem Cell Symmetric Self-Renewal Rate, the fraction of stem cells that divide symmetrically in any generation; Asym CC Time, the cell cycle time in hours for asymmetrically dividing TSCs; Sym CC Time, the cell cycle time in hours for symmetrically dividing TSCs; CPC CC Time, the cell cycle time in hours for committed progenitor cells; TDN: Turnover Division Number, the number of cell generations before CPC lineages terminate in non-dividing, terminally-arrested cells; Death Rate, the fraction of cells that die in any cell generation; SCFHL, TSC fraction half-life in units of CPD, cumulative population doublings. 3id, indeterminate interval boundary. | |||||
Changes in the SCF during serial culture depend on the rate of TSC symmetric self-renewing, the rate of TSCs death or loss by other mechanisms (e.g., differentiation or cell fusion), and the rate TSCs are diluted among other cells, which are produced either by asymmetric TSC divisions or division of CPCs. As shown in Figure 1C (blue trace), the TORTOISE Test® software uses the simulation-derived estimates of these rates to compute changes in SCF with the serial passage. All five sources of HSCs showed a characteristic decline in SCF with the continued passage [13].
The RABBIT Count® software relates the simulated SCF of cultures with passage time to respective simulated 72-hour PDTs [13]. These computations yield two different types of “Rabbit algorithms”. Rabbit PDT algorithms (Figure 2)
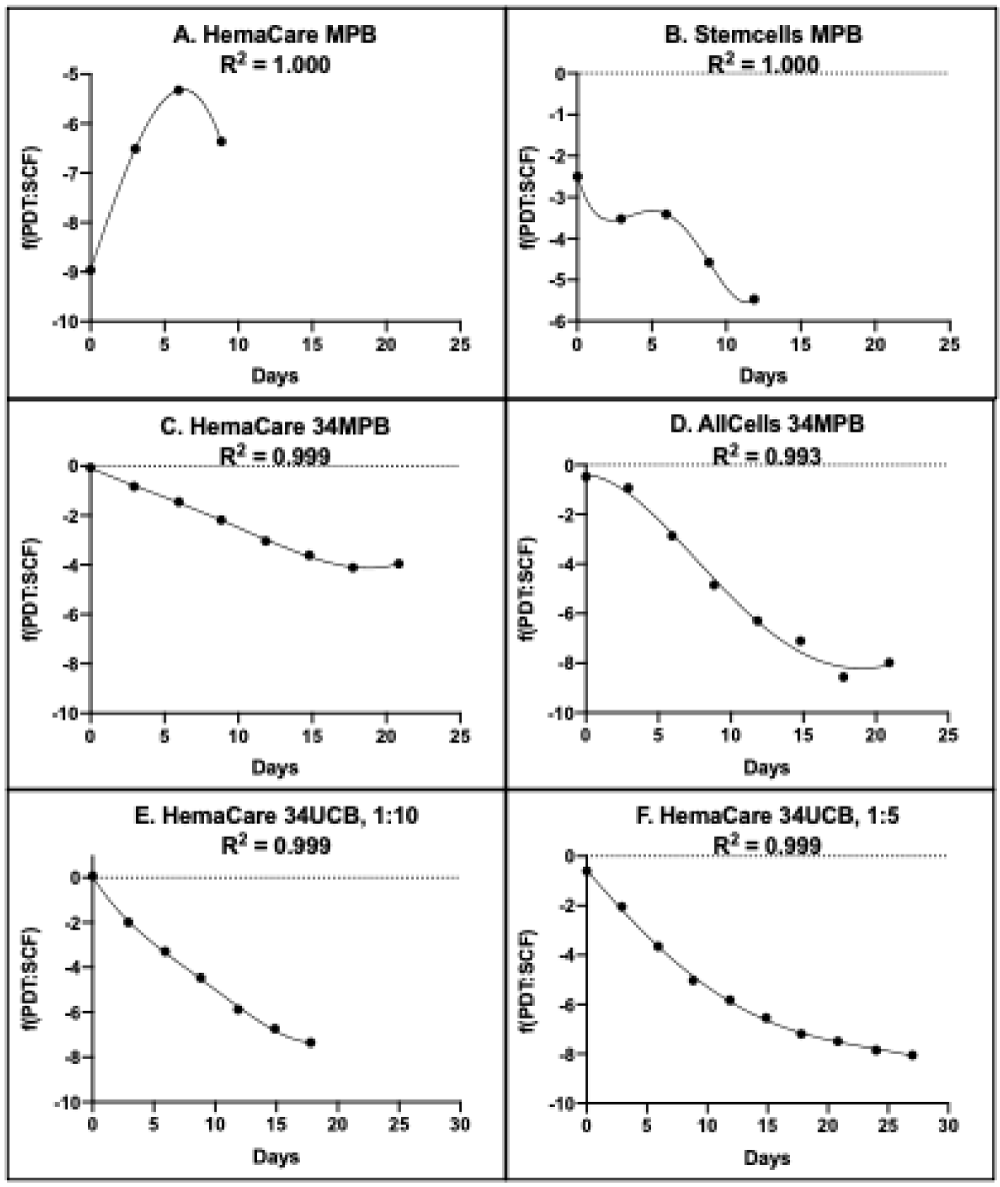
Figure 2: Rabbit PDT algorithms for rapid determination of HSC fraction. A-F. Each panel provides a graphical representation of the respective KSC counting PDT algorithm, f(PDT: SCF), that can be used to calculate the HSC fraction (SCF) of the indicated commercial human hematopoietic cell preparation and culture medium conditions by the input of only the day of serial culture and the subsequent 72-hour PDT of the culture. A-E. Algorithms were defined by RABBIT Count® software analyses of experimental CPD data from cultures maintained in the same culture medium (See Materials and methods) and passaged with a 1:10 split basis approximately every 3 days. F. Cells were cultured in the same medium as A-E, but instead passaged with a 1:5 split basis approximately every 3 days. 34, CD34+-selected fraction.
calculate the SCF of secondary serial cultures of the same source and culture conditions as the original by inputting the day of serial culture and the experimental PDT of the subsequent 72-hour period. Rabbit CPD algorithms (Figure 3) are a mathematical transform of the PDT algorithms that allows computation of the SCF of similar secondary cultures directly from an input of their number of CPDs. The CDP algorithms yield a novel TSC kinetics parameter called the stem cell fraction half-life (SCFHL). The SCFHL is the number of CPDs required for a 50% decrease in a culture’s SCF.
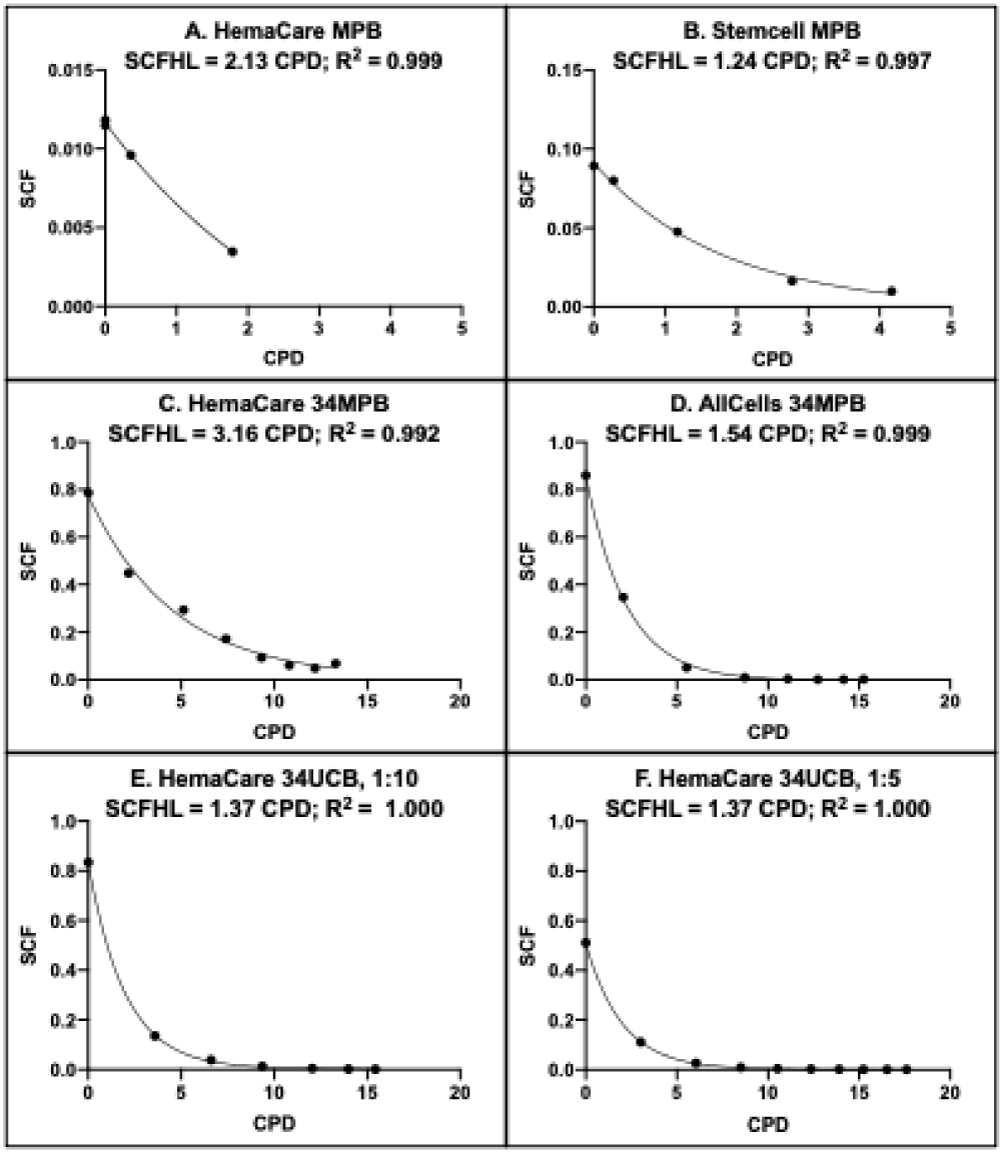
Figure 3: Rabbit CPD algorithms for rapid determination of HSC fraction. A-F. Each panel provides a graphical representation of the respective KSC counting CPD algorithm that can be used to calculate the HSC fraction (SCF) of the indicated commercial human hematopoietic cell preparation and culture medium conditions by the input of only the preparation’s number of CPDs. A-E. Algorithms were defined by RABBIT Count® software analyses of experimental CPD data from cultures maintained in the same culture medium (See Materials and methods) and passaged with a 1:10 split basis approximately every 3 days. F. Cells were cultured in the same medium as A-E, but instead passaged with a 1:5 split basis approximately every 3 days. 34, CD34+-selected fraction. SCFHL: SCF half-life.
The general qualities of the Rabbit PDT algorithms reflected the main biological distinctions of the HSC preparations. As shown in Figure 2, the Rabbit PDT algorithms for the CD34+-selected cell preparations were similar in mathematical form, whether originating from UCB cells (Figure 2E,2F) or adult donor peripheral blood (Figure 2C,2D). In contrast, the PDT algorithms for HSCs in unfractionated MPBC preparations (Figure 2A,2B) were mathematically distinctive from the CD34+-selected sources, as well as from each other.
The CPD algorithms for all HSC sources quantified the characteristic decline in HSC fraction with increasing serial culture passages. The computed SCFHLs ranged from 1.10 CPDs to 3.16 CPDs. It is noteworthy that the SCFHL of one source of CD34+-selected MPBCs (Table 1, CD34 MPBC, HemaCare) was significantly greater than the SCFHLs of all other HSC sources. This difference can be attributed to a higher rate of HSC symmetric self-renewing (Table 1, SC SSR), a lower rate of HSC death (Table 1, SC Death Rate), and a substantial rate of CPC death (Table 1, CPC Death Rate) in this source.
KSC counting Rabbit algorithm validations
Two studies evaluated the ability of Rabbit algorithms to confidently calculate the SCF of secondary cultures of the same tissue cell source and culture conditions with an input of experimental 72-hour PDT data. For the first evaluation, the same pooled source of CD34+ UCB cells shown in Figure 1 for serial culture with a 1:10 split basis was serially cultured in parallel with a 1:5 split basis. None of the determined initial cell kinetics factors (shown in Table 1) were significantly different between the 1:10 split basis and the 1:5 split basis (data not shown).
Consistent with this finding, analyses with the two different split bases yielded very similar PDT algorithms (Compare Figure 2E to Figure 2F) and equal SCFHLs (1.37 CPDs; Compare Figure 3E,3F). Inputting the experimental 72-hour PDT data from the 1:5 split basis serial culture into the PDT algorithm determined with the 1:10 split basis serial cultures yielded SCF calculations that had a high degree of agreement with the independent TORTOISE Test® software determinations of the SCF during serial culture with a 1:5 split basis (Figure 4; R2 = 0.980).
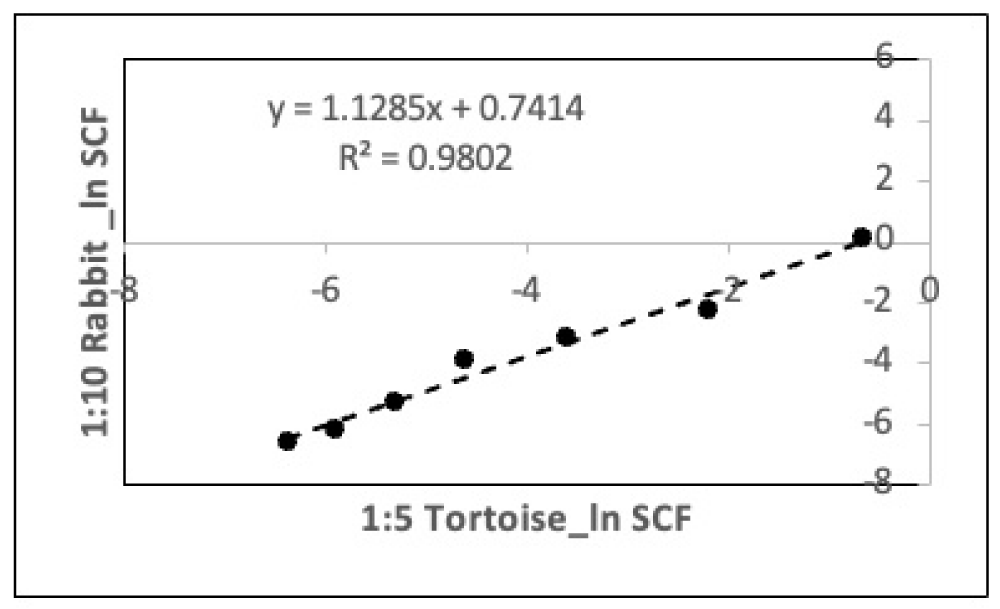
Figure 4: Validation analysis for the ability of a rapid-counting Rabbit PDT algorithm to accurately calculate the HSC fraction of CD34+-selected UCB cell preparations. Shown is an evaluation of the ability of a primary Rabbit PDT algorithm to accurately calculate the HSC fraction (SCF) of a parallel independent culture of the same type. Data from the parallel-serial culture analyses described in Figure 2E and Figure 2F, for respective 1:10 versus 1:5 split basis, were used for the analysis. Experimental mean PDT data from the 1:5 split basis study were input into the Rabbit algorithm developed with the 1:10 split basis study data to calculate HSC fraction data for the 1:5 split basis study. The natural logarithm of the HSC fraction data calculated with the Rabbit algorithm (1:10 Rabbit) was plotted versus the natural logarithm of the HSC fraction data determined by the primary TORTOISE Test® KSC counting software analysis of the 1:5 split basis study data (1:5 Tortoise). Note: data for the last three passages of the 1:5 split basis study, which have no correlate with the 1:10 split basis study, were not included in the analysis shown.
For the second evaluation, in parallel with the serial cultures described for the data in Figure 1, three independent bulk cultures were initiated in the same type of culture medium and cultured in parallel for 72 hours. The cells in the resulting 72-hour cell cultures were harvested and cryopreserved (See Material and methods for details). Several weeks later, one vial of cells corresponding to each of the three independent cryopreserved parallel cell cultures (Vials 1-3 in Figures 5,6)
was thawed and used to perform three secondary serial cultures (each in triplicate) for three respective secondary TORTOISE Test® KSC counting analyses. These passage 2 (P2) secondary cultures were also passaged with a 1:10 split basis. Figure 5 shows the mean SCF determinations for the three independent secondary TORTOISE Test® analyses. The three independent sets of SCF determinations show a high degree of consistency until the final passages, where variability in cell counting data increases because of low total cell numbers.
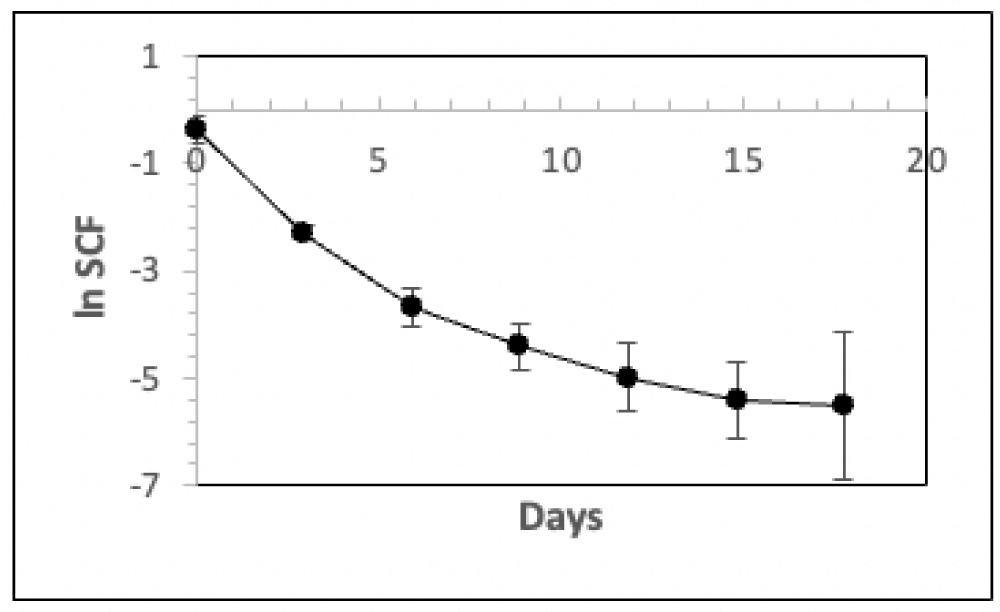
Figure 5: Analyses of the mean HSC fraction determinations for three independent P2 secondary KSC counting analyses. Triplicate parallel serial cultures were performed for three independent vials of cryopreserved human CD34+-selected UCB cells. The cells thawed for these passage 2 (P2) secondary cultures were derived from parallel cultures of the same cultures described in Figure 1 (See Materials and Methods). The natural logarithm of the mean HSC fraction (SCF) is plotted versus days of serial passage. The cell count data from the three respective sets of triplicate P2 secondary serial cultures were used to develop independent KSC counting software determinations of their HSC fractions (SCF) with the serial passage. The natural logarithm of the mean HSC fraction for the three TORTOISE Test® KSC counting analyses is plotted versus days of passage. Error bars = 95% confidence intervals.
To evaluate the ability of the original 1st-degree Rabbit PDT algorithm to accurately determine the SCFs for the secondary cultures, the mean experimental 72-hour PDT data from each secondary serial culture were input into the 1st-degree Rabbit PDT algorithm to calculate SCFs during serial passaging. The results of this evaluation are presented in Figure 6. The 1st-degree Rabbit PDT algorithm yielded SCF determinations with a high degree of accuracy as judged by their correlation with the SCF values determined by the independent secondary TORTOISE Test® analyses. The correlation coefficients range from 0.957 to 0.971 (Figures 6A-6C), and the correlation coefficient for a combined analysis including all three secondary cultures was 0.940, with statistical confidence at the level of p < 0.0001 (Figure 6D).
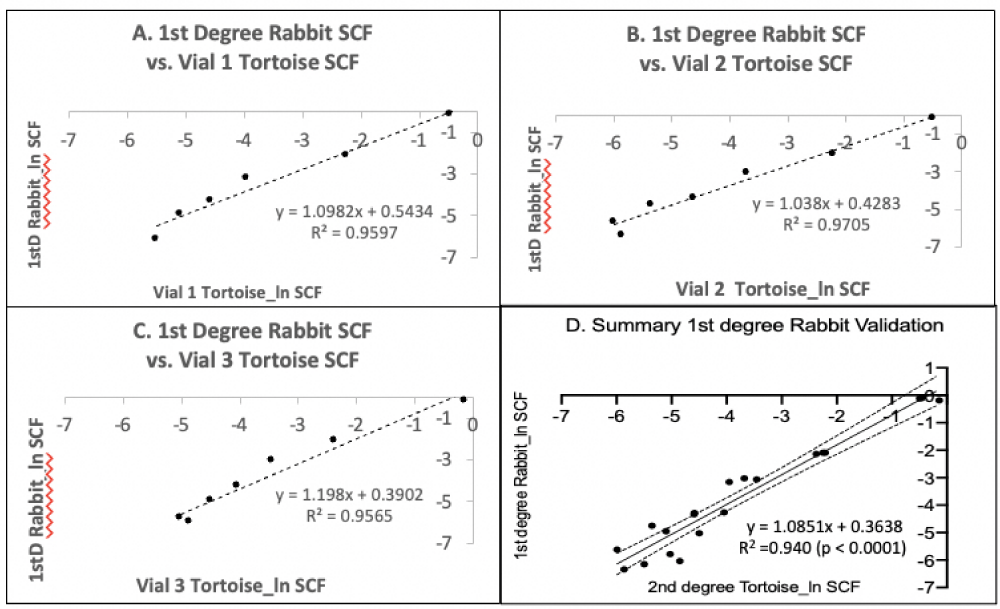
Figure 6: Validation analysis of the ability of a 1st-degree rapid-counting Rabbit PDT algorithm to accurately compute the HSC fraction of secondary serial cultures. A-C. Triplicate parallel serial cultures were performed for three independent vials of cryopreserved human CD34+-selected UCB cells (Vials 1-3; same as in Figure 5). The cells thawed for these passage 2 (P2) secondary cultures were derived from parallel cultures of the same cultures described in Figure 1 and used to develop the primary Rabbit PDT algorithm in Figure 2E (1stD Rabbit). The cell count data from the three respective sets of triplicate P2 secondary serial cultures were used to develop independent TORTOISE Test® KSC counting software determinations of their HSC fractions (SCF) with the passage. These data were evaluated for correlation with HSC fraction calculations made by inputting the respective experimental mean 72-hour PDT data of the P2 secondary serial cultures into the 1st-degree Rabbit PDT algorithm (Figure 2E). The natural logarithms of the SCF data were compared. D. The independent data sets in A-C were combined for an overall correlation estimation of the accuracy of the 1st-degree rapid-counting Rabbit PDT algorithm for the determination of the HSC fraction of secondary cultures of the same type. Dotted lines, 95% confidence.
Comparison of Rabbit PDT algorithm quantification to the SCID mouse repopulating cell assay
As a further validation of the accuracy of KSC counting Rabbit PDT algorithms, we evaluated two replicate samples of the same CD34+ UCB cells cryopreserved and thawed for the secondary-culture validation studies (Figure 6) in SCID mouse repopulating cell (SRC) assays. Cryopreserved replicates of Vial 2 and Vial 3 in Figure 6 were used for these analyses. The KSC counting-quantified HSC fractions of these samples were 0.61 (95% CI 0.47 - 0.75) and 0.87 (95% CI 0.74 - 1.00), respectively. Before injection into mice, the cells were thawed and cultured for 72 hours. Based on their respective PDT algorithms, this culture period would reduce their HSC fractions to 0.11 (95% CI = 0.08 - 0.14) and 0.09 (95% CI = 0.08 - 0.10), respectively.
Two independent cohorts of 32 NSG SCID mice were injected with a dilution series with the cultured cells. The lowest number of cells injected was 100 cells per mouse. In each cohort, 8 mice received the 100-cell injection. Based on the KSC counting algorithm determinations, each of these mice would have received on average about 10 HSCs. Given Poisson statistics, such a number of HSCs should lead to the engraftment of all injected animals, as was observed for both cohorts of mice. (All other groups of mice injected with higher numbers of cells [500, 2500, 7500] also showed complete engraftment).
The levels of chimerism for human CD45+ cells in the bone marrow of mice injected with 100 cells in the two respective cohorts ranged from 0.2% to 5.5% (mean ± SD = 1.8 ± 1.8) and from 0.6% to 1.5% (mean ± SD = 1.1 ± 0.3). Chimerism was also observed in the peripheral blood of the mice. The levels for CD45+ cells in the two cohorts ranged from 0.1% to 1.7% (mean ± SD = 0.5 ± 0.6) and from 2.1% to 3.8% (mean ± SD = 3.0 ± 0.6), respectively. Significant degrees of chimerism with CD45+ human cells expressing the differentiated cell markers CD20, CD66b, and CD71 were also observed in the mice (data not shown).
We report analyses of three commercial sources of human HSCs, used in stem cell medical treatments, with a recently developed technology designed for convenient, routine determination of TSC-specific fraction and dosage. Although the focus was human HSCs, the new technology, KSC counting, has general application for TSCs in many different mammalian tissues of interest for research and medicine.
Even though widely-used approved HSC transplantation treatments are currently practiced without HSC-specific dosing, patients would immediately benefit from this improvement. In particular, KSC counting could provide a long-needed effective basis for determining the potency of UCB units, which have a failure rate of 18% - 24% attributable to insufficient HSC dosage [23]. KSC counting quantification of the HSC-specific dosage for adult hematopoietic treatments might also allow more patients to be treated with scarce donor samples. The implementation of HSC-specific dosage would enable better-designed stem cell clinical trials and provide greater statistical power for evaluations of their effectiveness [3-6].
The presented studies had two main validation goals for KSC counting. Previously, published serial culture data were deployed to demonstrate the ability of the KSC counting technology to detect and quantify the well-described increase in the HSC fraction of CD34+-selected human hematopoietic tissue cell populations [13].
Here, we demonstrated this validation directly with two independent sources of commercial hematopoietic cells. The second validation goal was to confirm that previously described rapid-counting mathematical algorithms, herein named “Rabbit algorithms” because of their speed, were able to calculate the SCF from the PDT of cultures with a high degree of statistical confidence. The presented results establish that both validation goals were achieved.
The HSC fractions determined by KSC counting for two independent commercial sources of unfractionated MPBCs fall within the range of typical expectations (Table 1; 2% and 15%). However, all the commercial CD34+-selected preparations had high HSC fractions that were not in the range of expectations based on our prior experience (Table 1; 72%, 78% and 83%). These HSC fractions were significantly higher than the fractions reported previously for KSC counting based on published serial culture data for CD34+-selected UCB cells (8.0% and 0.24% with a 20-fold enrichment by CD34+ selection) [13]. Therefore, the present results are specific to the newly examined samples and not a general feature of the KSC counting method. Supporting this conclusion, when CD34+ UCB cell samples were evaluated by SRC assay, the high efficiency of engraftment observed was consistent with the high HSC fractions determined by KSC counting algorithms. We emphasize here that, although the SRC assay could be used for this confirmation, it lacks sufficient precision to evaluate the quantitative HSC fraction defined by KSC counting.
The major proposed value of KSC counting is convenient, routine determination of the specific fraction and specific dosage of therapeutic TSCs, like HSCs in this report, and others as well like MSCs, liver stem cells, and corneal stem cells [13]. Here, we increased our experience with the properties of mathematical algorithms that were defined previously for more rapid counting of TSCs. Intrinsic to their derivation, the Rabbit PDT algorithms quantitatively and qualitatively manifest cell-autonomous TSC kinetics properties and secondary effects on SCF due to the cell kinetics of other tissue cell types present in tissue cell cultures. This signature character of the algorithms was evident from the similarity of PDT algorithms for three different sources of CD34+-selected hematopoietic cell preparations. Such fractionated cell populations are expected to be more homogeneous for HSCs and CPCs. However, unfractionated mobilized peripheral blood cells are significantly more heterogeneous for cell type and cell proliferation kinetics. In fact, in these preparations, the modeled compartments for transiently dividing “CPCs” and “terminally-arrested cells” include all hematopoietic cell differentiation lineages. The greater cell heterogeneity was associated with PDT algorithms that differed significantly in mathematical form between different donors and from CD34+-selected cells.
Finally, we describe the development of a new type of algorithm, Rabbit CPD algorithms. CPD algorithms can be used to define a new quantitative TSC kinetics parameter, the SCFHL. SCFHL is a simple new state function parameter for TSCs that reflects the interplay of the several complex cell kinetics factors that intersect to determine changes in SCF during serial cell culture. The Rabbit CPD algorithms that define SCFHL can be used to determine or project the SCF of a cell preparation based on its present or future number of CPDs. We anticipate that the SCFHL will have significant utility in the biomanufacturing industry for tissue-engineered medicinal products (TEMPs) and the supply of TSC products for stem cell and gene therapies.
Kinetic stem cell (KSC) counting is a recently developed technology for the quantification of the specific fraction and dosage of therapeutic tissue stem cells (TSCs), like hematopoietic stem cells (HSCs). Further validation of the specificity and accuracy of KSC counting was achieved by demonstrating the technology’s ability to quantify the enrichment of HSCs in commercially supplied CD34+-selected mobilized peripheral blood cell preparations. New “Rabbit algorithms” are described that allow rapid quantification of HSC fraction and dosage based on either the population doubling time (PDT) or the cumulative population doublings (CPD) of cultured hematopoietic cell preparations. The Rabbit CPD algorithms provide a novel TSC kinetics parameter called the stem cell fraction half-life (SCFHL), which is the number of culture CPDs required for the TSC-specific fraction to decrease by 50%. The SCFHL of examined commercial human HSC sources ranged from 1.10 CPDs to 3.16 CPDs. The Rabbit algorithms exhibited a high degree of confidence for calculating the HSC fraction of parallel and secondary preparations of CD34+ umbilical cord blood (UCB) cell preparations, with R2 values ranging from 0.940 to 0.980. Moreover, the accuracy of the algorithms for HSC fraction determinations was supported by direct comparison to SCID mouse repopulating cell assays. These latest characterizations of the new KSC counting technology further validate its potential to be the long-needed method for routine quantification of the specific fraction and specific dosage for TSCs for stem cell research and stem cell medicine.
This research was supported by SBIR Phase I grant #1R43HL154900-01 from the National Institutes of Health-National Heart, Lung, And Blood Institute (NIH-NHLBI) and Technical Project grant #2019-02T-T0227 from Advanced Regenerative Manufacturing Institute (ARMI)|BiofabUSA. The content is solely the responsibility of the authors and does not necessarily represent the official views of the National Institutes of Health. We thank Dr. A. S. Burnside for initial expert consultation to refine procedures for serial culture of CD34+ UCB cells. We thank the staff of the Indiana University in vitro Therapeutics & Angio BioCore Facility for excellent technical execution of SCID mouse assays and analyses. We thank Dr. R. R. Taghizadeh for reviewing the manuscript and providing helpful comments for its completion.
Conflict of interest: Asymmetrex®, LLC is a for-profit company that markets KSC counting as a service. JLS is the President & Chief Executive Officer of the company, and RAD is the Chief Technology Officer.
MPD declares no conflicts of interest.
- Ivanovic Z. Hematopoietic stem cells in research and clinical applications: The "CD34 issue". World J Stem Cells. 2010 Apr 26;2(2):18-23. doi: 10.4252/wjsc.v2.i2.18. PMID: 21607112; PMCID: PMC3097920.
- Sherley JL. Principles for targeting adult tissue stem cells to achieve durable gene and gene-editing therapeutics. In: Appasani K, ed. Genome Editing and Engineering: From Talens, ZFN, and CRISPRs to Molecular Surgery. Cambridge: Cambridge University Press, 2018:285-300.
- Sherley JL. Dose determination for stem cell medicine: a need whose time has come. In: Atala A, Cetrulo C, Cetrulo K, Murphy SV, Taghizadeh R, eds. Perinatal Stem Cells: Research and Therapy. Amsterdam: Elsevier, 2018:383-397.
- Sherley JL. Stem cell therapy: resolving the mismatch. Pharmaceutical Manufacturing. 2018; 38-41.
- Sherley JL. Achieving dose standardization for the stem cell clinical trials industry. Operations 10:03, May 31, 2018; http://www.clinicaltrialsarena.com/news/operations/achieving-dose-standardization-for-the-stem-cell-clinical-trials-industry-6172126.
- Sherley JL. Why don’t stem-gene clinical trial sponsors count their stem cells? Arena Intl. Events Grp. H1 Virtual Events: Review and Summary Handbook 2021; 14-16. https://content.yudu.com/web/442ay/0A447nd/H1VE-RSH21/html/index.html?page=2&origin=reader.
- Kassar-Duchossoy L, Giacone E, Gayraud-Morel B, Jory A, Gomès D, Tajbakhsh S. Pax3/Pax7 mark a novel population of primitive myogenic cells during development. Genes Dev. 2005 Jun 15;19(12):1426-31. doi: 10.1101/gad.345505. PMID: 15964993; PMCID: PMC1151658.
- Yin H, Price F, Rudnicki MA. Satellite cells and the muscle stem cell niche. Physiol Rev. 2013 Jan;93(1):23-67. doi: 10.1152/physrev.00043.2011. PMID: 23303905; PMCID: PMC4073943.
- Huh YH, Noh M, Burden FR, Chen JC, Winkler DA, Sherley JL. Sparse feature selection identifies H2A.Z as a novel, pattern-specific biomarker for asymmetrically self-renewing distributed stem cells. Stem Cell Res. 2015 Mar;14(2):144-54. doi: 10.1016/j.scr.2014.12.007. Epub 2015 Jan 6. PMID: 25636161; PMCID: PMC4363179.
- Homma S, Chen JC, Rahimov F, Beermann ML, Hanger K, Bibat GM, Wagner KR, Kunkel LM, Emerson CP Jr, Miller JB. A unique library of myogenic cells from facioscapulohumeral muscular dystrophy subjects and unaffected relatives: family, disease and cell function. Eur J Hum Genet. 2012 Apr;20(4):404-10. doi: 10.1038/ejhg.2011.213. Epub 2011 Nov 23. PMID: 22108603; PMCID: PMC3306860.
- L Ramos T, Sánchez-Abarca LI, Muntión S, Preciado S, Puig N, López-Ruano G, Hernández-Hernández Á, Redondo A, Ortega R, Rodríguez C, Sánchez-Guijo F, del Cañizo C. MSC surface markers (CD44, CD73, and CD90) can identify human MSC-derived extracellular vesicles by conventional flow cytometry. Cell Commun Signal. 2016 Jan 12;14:2. doi: 10.1186/s12964-015-0124-8. PMID: 26754424; PMCID: PMC4709865.
- Purton LE, Scadden DT. Limiting factors in murine hematopoietic stem cell assays. Cell Stem Cell. 2007 Sep 13;1(3):263-70. doi: 10.1016/j.stem.2007.08.016. PMID: 18371361.
- Dutton R, Abdi F, Minnetyan L, Sherley JL. A computational technology for specific counting of perinatal and postnatal human tissue stem cells for transplantation medicine,” OBM Transplantation. 2020; 4:24; doi:10.21926/obm.transplant.2003117.
- Paré JF, Sherley JL. Biological principles for ex vivo adult stem cell expansion. In: Schatten G, ed. Current Topics in Developmental Biology. 73. San Diego: Elsevier Inc., 2006; 73: 141-171.
- Rambhatla L, Bohn SA, Stadler PB, Boyd JT, Coss RA, Sherley JL. Cellular Senescence: ex vivo p53-Dependent Asymmetric Cell Kinetics. J Biomed Biotechnol. 2001;1(1):28-37. doi: 10.1155/S1110724301000079. PMID: 12488624; PMCID: PMC79675.
- Merok JR, Sherley JL. Breaching the Kinetic Barrier to in vitro Somatic Stem Cell Propagation. J Biomed Biotechnol. 2001;1(1):25-27. doi: 10.1155/S1110724301000067. PMID: 12488623; PMCID: PMC79674.
- Sherley JL. New cancer diagnostics and therapeutics from a ninth 'hallmark of cancer': symmetric self-renewal by mutated distributed stem cells. Expert Rev Mol Diagn. 2013 Nov;13(8):797-810. doi: 10.1586/14737159.2013.845087. PMID: 24151848.
- Potten CS, Morris RJ. Epithelial stem cells in vivo. J Cell Sci Suppl. 1988;10:45-62. doi: 10.1242/jcs.1988.supplement_10.4. PMID: 3077942.
- Loeffler M, Potten CS. Stem cells and cellular pedigrees - a conceptual introduction. In: Potten CS, ed. Stem Cells. San Diego: Harcourt Brace & Co. 1997: 1-28.
- McDermott SP, Eppert K, Lechman ER, Doedens M, Dick JE. Comparison of human cord blood engraftment between immunocompromised mouse strains. Blood. 2010 Jul 15;116(2):193-200. doi: 10.1182/blood-2010-02-271841. Epub 2010 Apr 19. PMID: 20404133.
- Nowlan B, Williams ED, Doran MR, Levesque JP. CD27, CD201, FLT3, CD48, and CD150 cell surface staining identifies long-term mouse hematopoietic stem cells in immunodeficient non-obese diabetic severe combined immune deficient-derived strains. Haematologica. 2020 Jan;105(1):71-82. doi: 10.3324/haematol.2018.212910. Epub 2019 May 9. PMID: 31073070; PMCID: PMC6939540.
- Hayflick l. The limited in vitro lifetime of human diploid cell strains. Exp Cell Res. 1965 Mar;37:614-36. doi: 10.1016/0014-4827(65)90211-9. PMID: 14315085.
- Olsson R, Remberger M, Schaffer M, Berggren DM, Svahn BM, Mattsson J, Ringden O. Graft failure in the modern era of allogeneic hematopoietic SCT. Bone Marrow Transplant. 2013 Apr;48(4):537-43. doi: 10.1038/bmt.2012.239. Epub 2012 Dec 10. Erratum in: Bone Marrow Transplant. 2013 Apr;48(4):616. PMID: 23222384.